Cryptocurrency Circle Academician: On July 15, Ethereum (ETH) averages and indicators have collectively shown unusual movements, is a new round of volatility approaching for Ethereum? Latest market analysis reference
Ethereum's current price is 1870, having risen from 1503 to 1870, a 25% rebound that is very attractive, but the upper levels of 1900 and 2000 are all stuck positions, making every step difficult, do not blindly look bullish. The 4-hour bullish momentum is weakening, and there is significant pressure on the daily line; going long now is a gamble, going short is also a gamble, try small positions to test the waters, do not heavily gamble on direction, especially for those of us who bought below 1600, this long position requires patience, do not rush to sell, you can exit in batches.
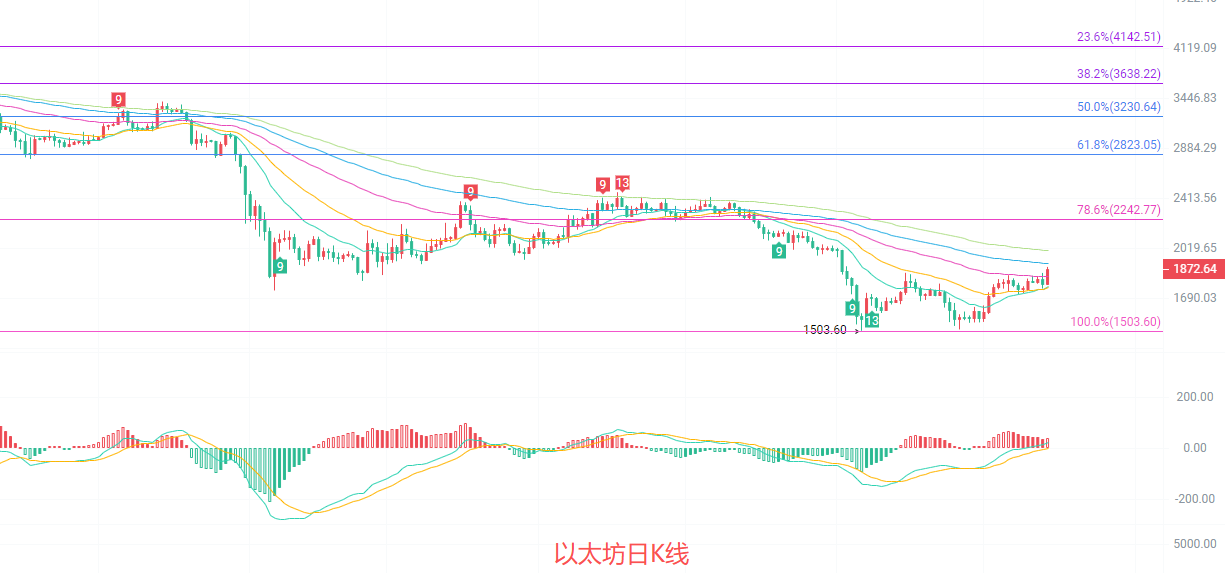
The daily candlestick has formed a solid bullish line, directly standing above the EMA15 moving average at 1763, currently challenging the pressure bands of the EMA30 moving average at 1755 and the EMA60 moving average at 1829. The MACD indicator shows red bars that continue to expand, with the DIF and DEA golden cross moving upwards, indicating significantly enhanced northward momentum; the middle track of the Bollinger Bands at 1709 has been stabilized, the upper track at 1906 constitutes strong short-term pressure, while the lower track at 1512 serves as the ultimate support for this round of decline. The Fibonacci 78.6% position at 2242 remains a key pressure level above, and the current rebound has not yet reached this point, with the trend still in the recovery phase following a decline.
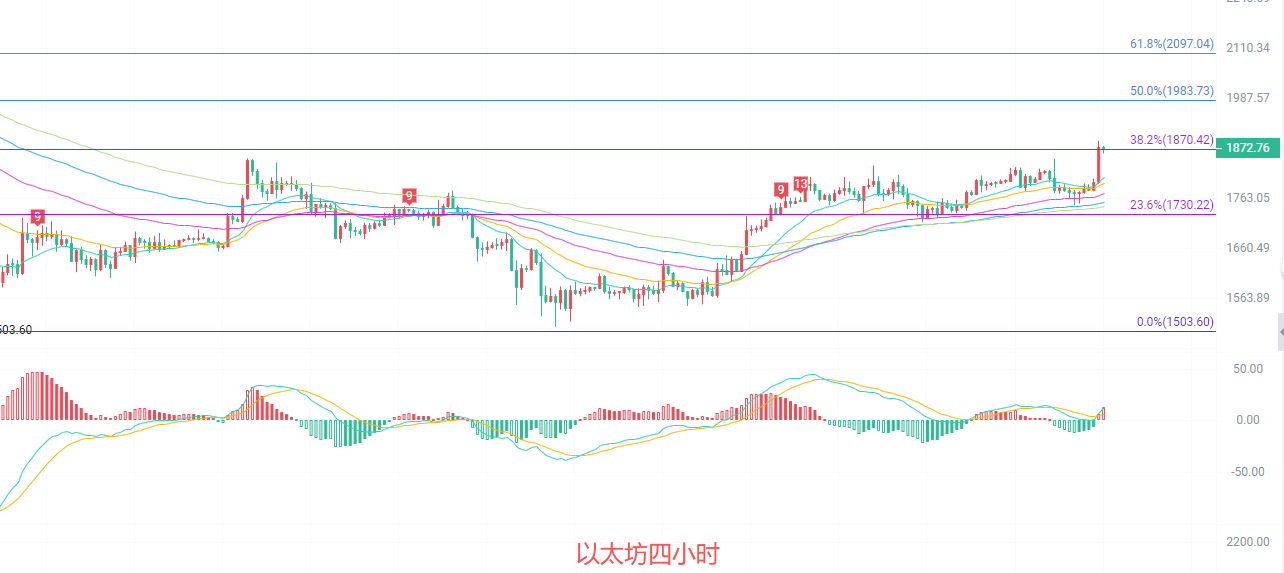
The 4-hour candlestick has broken through the resistance of the three moving averages EMA15, EMA30, and EMA60, currently oscillating above the EMA15 moving average at 1807, with the short-term moving averages forming a northward arrangement. The MACD indicator shows DIF running above DEA, with the red bars slightly shortening, indicating a decrease in short-term northward momentum and a need for a retest to confirm support; the Bollinger Bands are opening upwards, with prices close to the upper track at 1859, and the middle track at 1802 providing strong support. The Fibonacci 38.2% position at 1870 coincides with the current price; if effectively broken, it will open up space above to the 50% position at 1983; conversely, it may retest the 23.6% position at 1730.
Short-term reference:
If the lower range of 1830 to 1780 holds, look north, stop loss at 1750, target at 18820 to 1930.
If the upper range of 1930 to 1960 holds, look south, stop loss at 2000, target at 1880 to 1830.
Specific operations should focus on real-time market data; for more information, you can consult the author. The publication of the article has a delay, and it is advised to use it for reference only; risks are undertaken by the reader.

Warm reminder: The above content is solely created by the author of the official account. Advertisements at the end of the article and in the comments section are unrelated to the author. Please be cautious in discerning; thank you for reading.
免责声明:本文章仅代表作者个人观点,不代表本平台的立场和观点。本文章仅供信息分享,不构成对任何人的任何投资建议。用户与作者之间的任何争议,与本平台无关。如网页中刊载的文章或图片涉及侵权,请提供相关的权利证明和身份证明发送邮件到support@aicoin.com,本平台相关工作人员将会进行核查。