Good morning, friends. I am Sister Qinglan. When I opened the market this morning, what I saw was a screen full of panic. From last night to today, the market has been hit hard by two major bad news. One is that the U.S. government transferred nearly $300 million in BTC and ETH to Coinbase, which directly increased the potential selling pressure, and the market sentiment was instantly suppressed. The other is the escalation of the U.S.-Iran conflict, leading to a surge in oil prices, a sharp decline in U.S. semiconductor stocks, and Bitcoin also fell over 2%, putting global risk assets under pressure. What is even more concerning is that the probability of the Federal Reserve raising interest rates in July has risen to 50%. If Tuesday's CPI data exceeds expectations, the interest rate hike expectations will further suppress BTC. These messages combined have made today's market extremely sensitive. We should not be led by emotions; we need to speak with data and make decisions with systems. Today, Sister Qinglan will use the TPV system to analyze the current market.
Current Price and Time
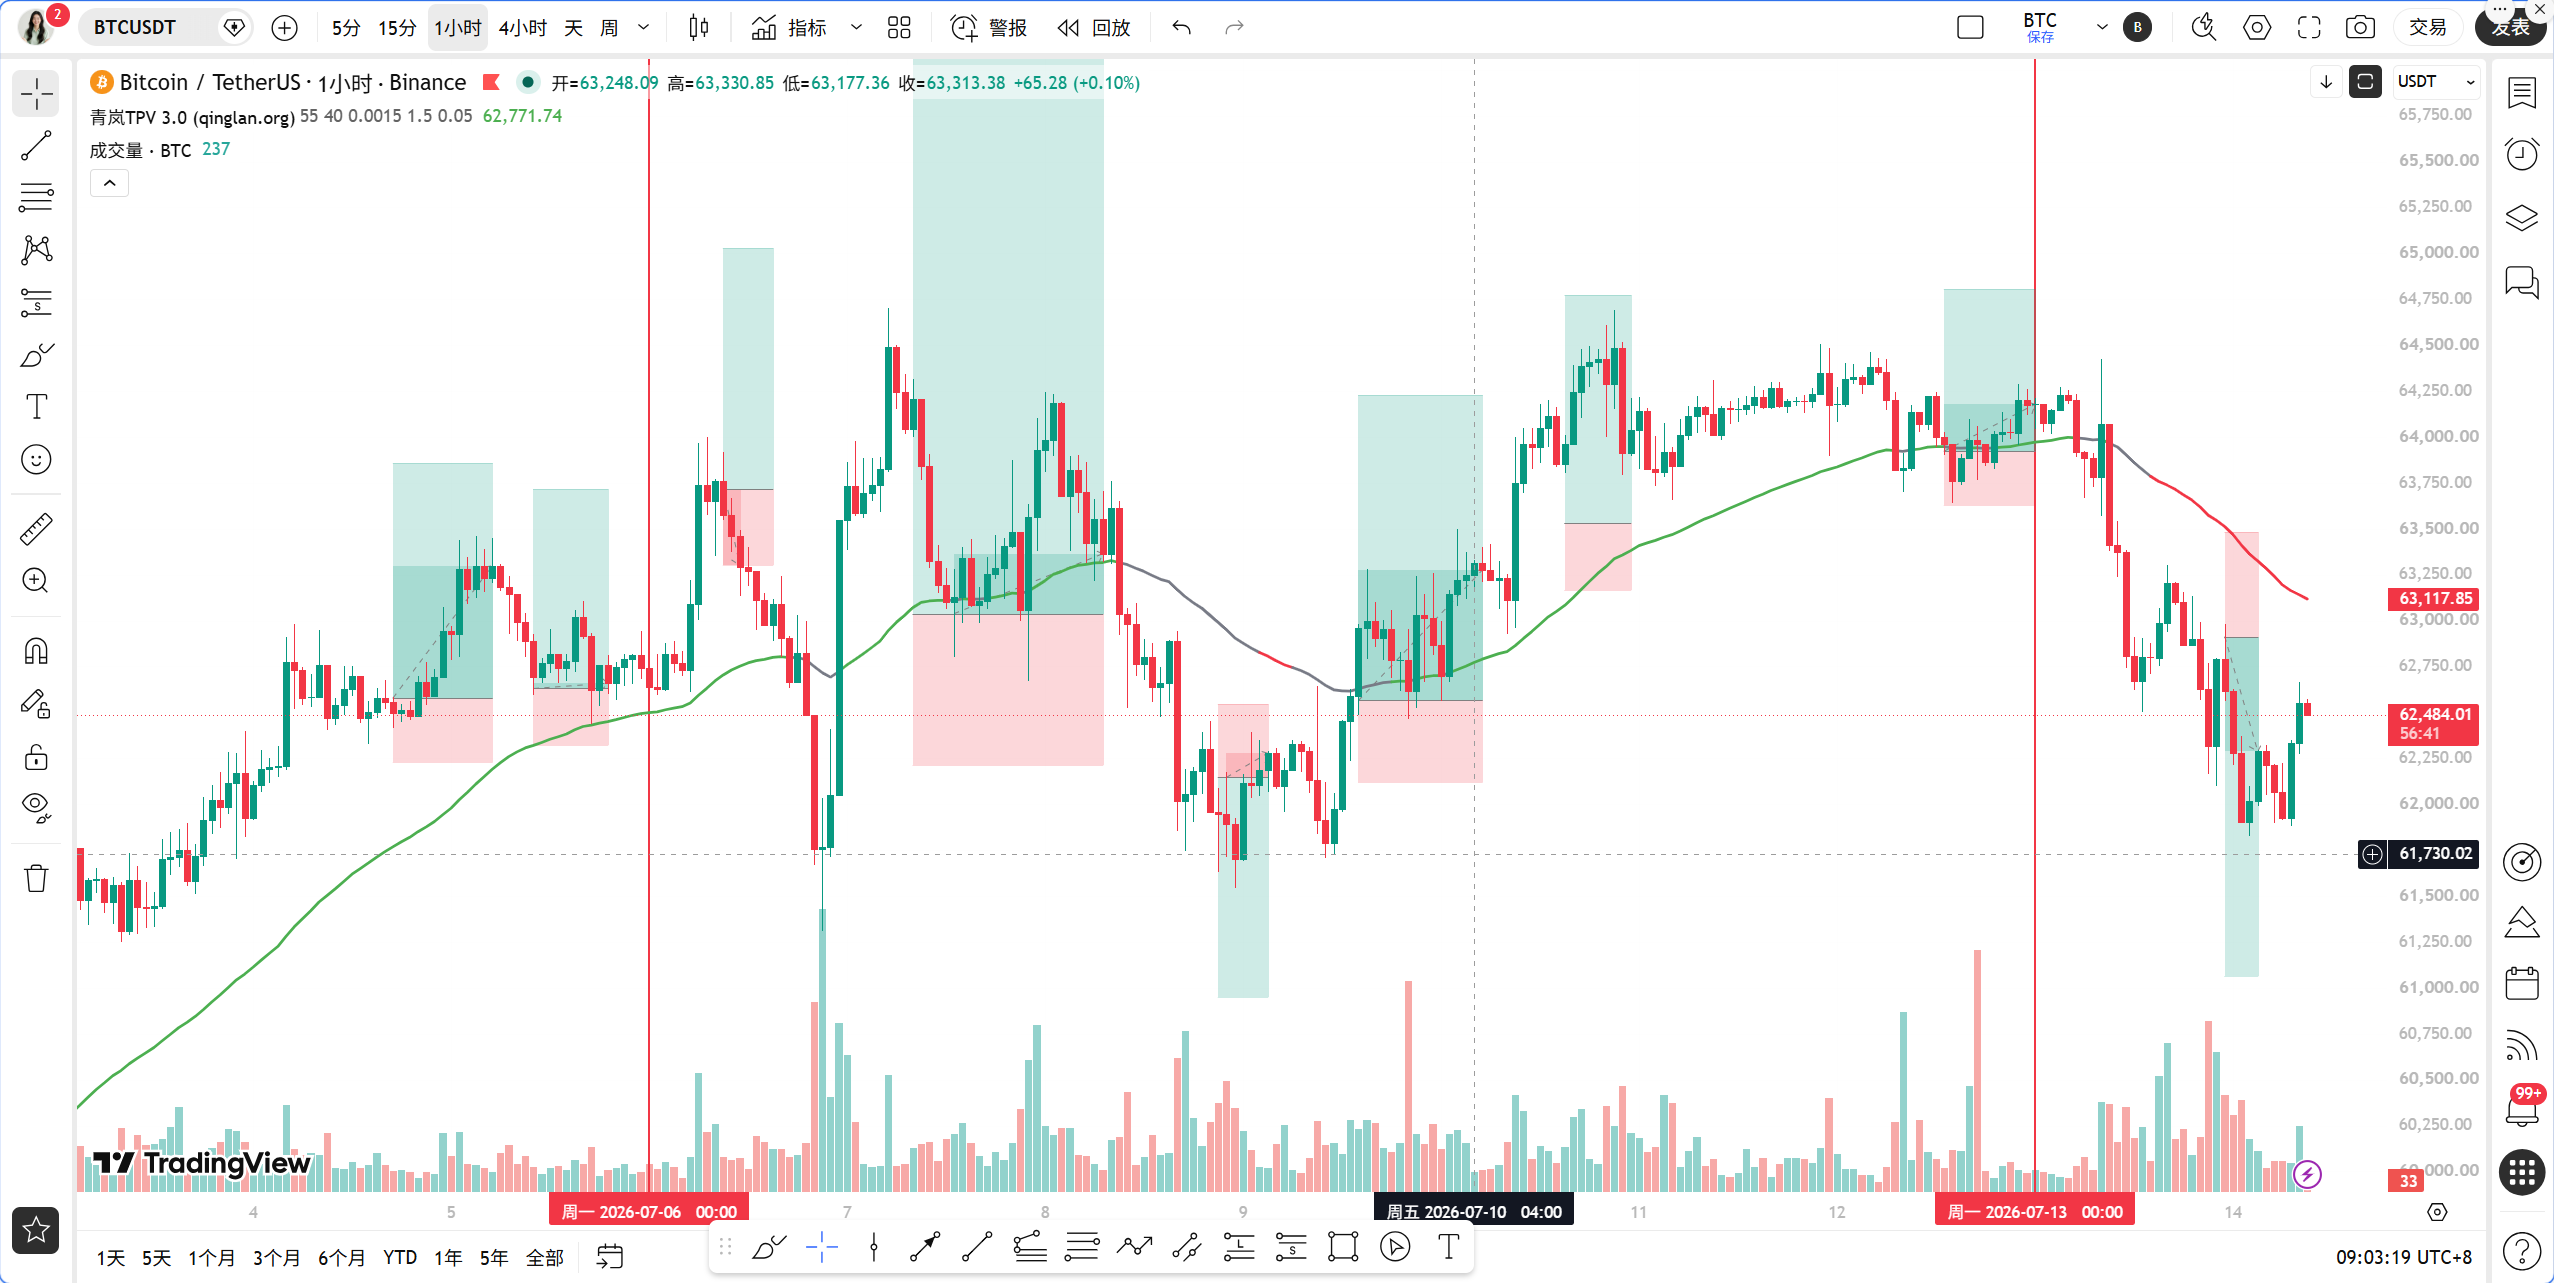
The current time is July 14, 09:07, with the latest Bitcoin quote at 62484 USDT. The 24-hour decline is 2.28%, and the fear and greed index is only 22, which belongs to the extreme fear zone. At this level, many people are already panicking, but I want to remind everyone that panic often means that opportunities are brewing; the key is to find a safe entry point.
Overview of Multi-Cycle Status
Let’s first look at the daily chart. The daily MA5 is at 63315, MA10 is at 63315, MA30 is at 62576, and the price of 62484 has now fallen below all short-term moving averages, positioning it below the moving averages. The MACD’s DIF is -296.84, and the DEA is -608.54. Although the histogram shows a positive value of 311.70, this is a sign of recovery from a low, not a reversal signal. The RSI is 67.51, still in a moderately strong area, indicating that the downward momentum at the daily level has not yet been fully released. Overall, the daily chart is in a bearish trend, but there is support at MA30 below, which is a critical position.
Now looking at the 4-hour chart. The 4-hour MA5 is at 62525, MA10 is at 63060, MA30 is at 63570, and the price has fallen below all moving averages, with a very clear bearish layout. The MACD’s DIF is -258.67, DEA is -41.09, and the histogram is -217.58, which indicates a death cross state, and bearish momentum is still being released. The RSI is only 27.74, entering the oversold area. The 4-hour level is seriously oversold, but overselling does not mean a rebound is imminent; we need to see clear stabilization signals.
At the 1-hour level, the 1-hour MA5 is at 62271, MA10 is at 62205, MA30 is at 62839, and the price is oscillating between MA5 and MA10 but below MA30. The MACD’s DIF is -305.19, DEA is -363.86, and the histogram is 58.67, which is still negative, but the histogram is shortening, indicating a weakening of the downward momentum. The RSI is at 43.82, in the neutral to weak area. The 1-hour EMA55 is at 63138, and the price of 62484 is far below this position, confirming a clear bearish trend.
At the 15-minute level, the 15-minute MA5 is at 62430, MA10 is at 62275, MA30 is at 62150, and the price is running above the moving averages, showing signs of a short-term rebound. The MACD’s DIF is 49.22, DEA is -8.84, and the histogram is 58.06, which has already gold crossed, and the RSI is 67.09, showing short-term momentum is bullish. However, the 15-minute level is too small and can only serve as a reference for short-term trades, not as a basis for trend judgments.
TPV Signal Verification
According to the core rules of the Qinglan TPV system, we will first use the 1-hour EMA55 as the boundary for long and short positions. The current 1-hour EMA55 is 63138, and the price of 62484 is clearly below this position, indicating that we are currently in a bearish trend area.
Next, we verify the conditions for shorting. First, the price is under pressure below the 1-hour EMA55. In the past 8 1-hour candles, there have been 0 instances where the closing price exceeded the EMA55, and 0 crossings; the absolute distance from the EMA55 is 1.04%, which does not meet the fluctuation threshold and belongs to a one-sided bearish trend. This condition is fully met.
Second, the pressure is blocked. We need to see long upper shadows, top formations, or pullbacks from effective highs. From the 1-hour candlestick chart, the recent few candlesticks show significant upper shadows when rebounding to around 62600, indicating that there is heavy pressure above, and bears are suppressing the rebound. This condition is also met.
Third, the rebound lacks strength. Although the MACD histogram at the 1-hour level has shortened, it has not yet shortened for two consecutive cycles, and the RSI has risen from 43.82, but it has not yet fallen back from above 70, so this condition has not been fully confirmed. However, looking at the overall momentum, the rebound strength is very weak, and bearish momentum still dominates.
In summary, the current TPV system signals a bearish trend, but the third condition for shorting has not yet fully matured; we need to wait for a confirmation of the signal showing weakness in the rebound before entering. If the price rebounds near EMA55 and meets resistance again, it will be a very good shorting opportunity.
On-Chain/Funding Aspects
In terms of on-chain data, the fear and greed index is only 22, indicating extreme fear. This value usually appears in the bottom area of the market, but a bottom is a range, not a point. Although the supply of stablecoins has turned positive, the trend of BTC selling continues, indicating that while the funding situation has improved, the selling pressure still exists. The $300 million asset transferred into exchanges by the U.S. government could at any time become a force for a sell-off. Overall, the on-chain funding appears bearish, but the extreme fear sentiment may signal that a rebound is about to come.
Key Offensive and Defensive Positions
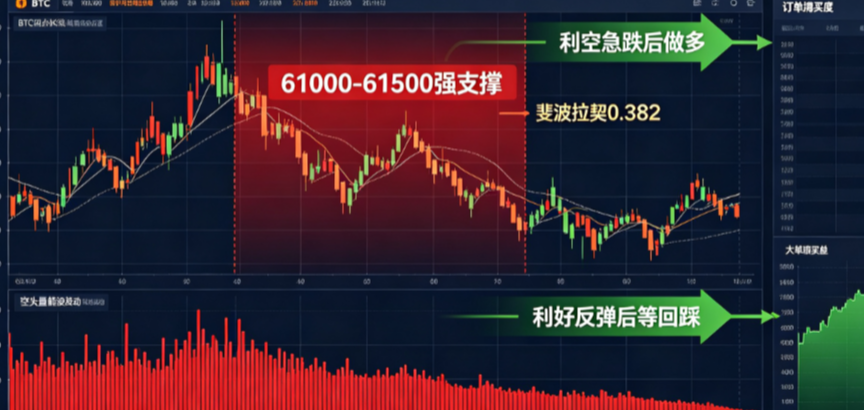
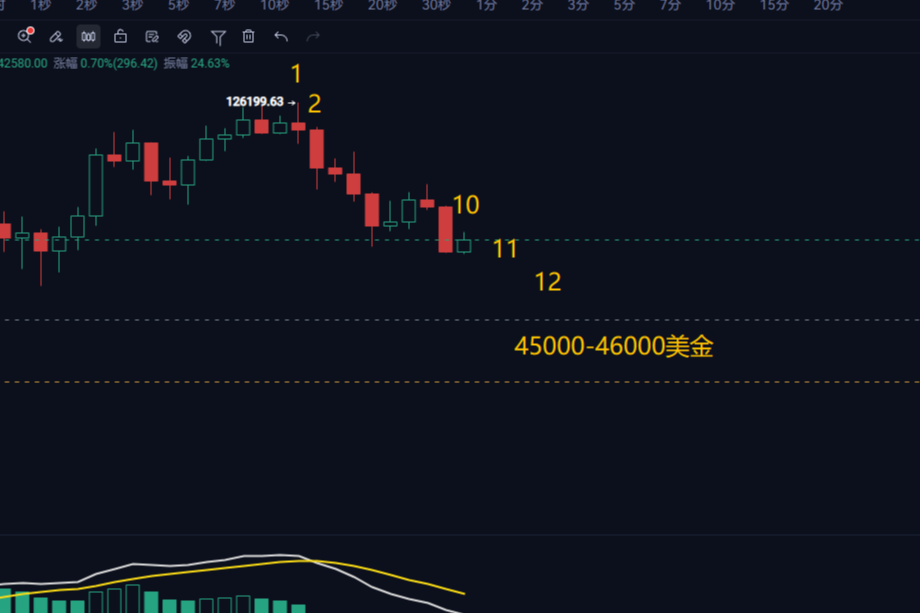
The first resistance level above is the 1-hour EMA55 at 63138, which is the boundary separating the bearish trend and is also the first hurdle for a rebound. If the price can break through and hold this position, the bearish trend may turn into consolidation. The second resistance level is the 4-hour MA30 at 63570, which poses stronger resistance. The first support level below is the psychological level of 62000, which has already been breached once last night; if it falls again, the next support level is the psychological level of 60000. Further down, we have the previous low of 58000.
Trading Strategy
Based on the signals from the TPV system and the current market, Sister Qinglan provides the following trading strategy.
Direction: Bearish is the main focus, but wait for the confirmation of the weakness in the rebound before entering. Currently, it is not recommended to chase the shorts, as the 4-hour chart is already oversold and a rebound may occur at any time.
Entry Conditions: Wait for the price to rebound to near the 1-hour EMA55, specifically in the 63100-63200 range. If a long upper shadow or a top formation appears, meanwhile the MACD histogram shortens for two consecutive cycles, and the RSI falls back from above 70, then enter a short position. If the price directly breaks below 62000 with volume, a light short position can also be pursued, but the risk is relatively high.
Stop Loss: If shorting, set the stop loss above 63570, which is above the 4-hour MA30. If going long, set the stop loss below 61800.
Target Position: The first target is 62000, the second is 60000, and the third is 58000. If the price breaks below 60000, the bearish trend will be further strengthened.
If a clear bottom formation or long lower shadow appears near 62000, while the MACD histogram shortens for two consecutive periods and the RSI rises from below 30, a light long position can also be considered, with the target at around 63100 and stop loss at 61800. However, this is a counter-trend trade, so the position should be light.
Risk Warning
The current market is under multiple bearish pressures, and volatility may intensify. Any trading must strictly control position size, set stop losses appropriately, and avoid holding losing positions.
Follow Qinglan Crypto Classroom to grasp more trading opportunities! Welcome to visit the official website www.qinglan.org
📊 Qinglan TPV Trading Strategy Backtest Reference
🕒 Last Backtest Time 07-14 07:00:02
Total Analysis: 2930 Backtests: 2268 Accuracy: 76% (1723/2268)
免责声明:本文章仅代表作者个人观点,不代表本平台的立场和观点。本文章仅供信息分享,不构成对任何人的任何投资建议。用户与作者之间的任何争议,与本平台无关。如网页中刊载的文章或图片涉及侵权,请提供相关的权利证明和身份证明发送邮件到support@aicoin.com,本平台相关工作人员将会进行核查。