Scholar in the cryptocurrency circle: 7.14 Ethereum (ETH) dual-cycle indicator warning, is a showdown between bulls and bears imminent? Latest market analysis reference
The current price of Ethereum is 1771, and Ethereum is currently in a typical oscillating pattern, with equal strengths on both sides. Before a clear signal emerges, there is a high risk in heavy speculation, and blindly following the trend can easily lead to a passive position. When trading, it's crucial to restrain greed, avoid frequent short-term operations, and strictly plan positions and stop losses. The technical aspects currently show no signs of a unilateral launch; rather than betting on direction, it is better to respond steadily according to the range strategy. It is more important to rationally view price fluctuations, constrain operations with rules, than to rely on momentary luck for profit.
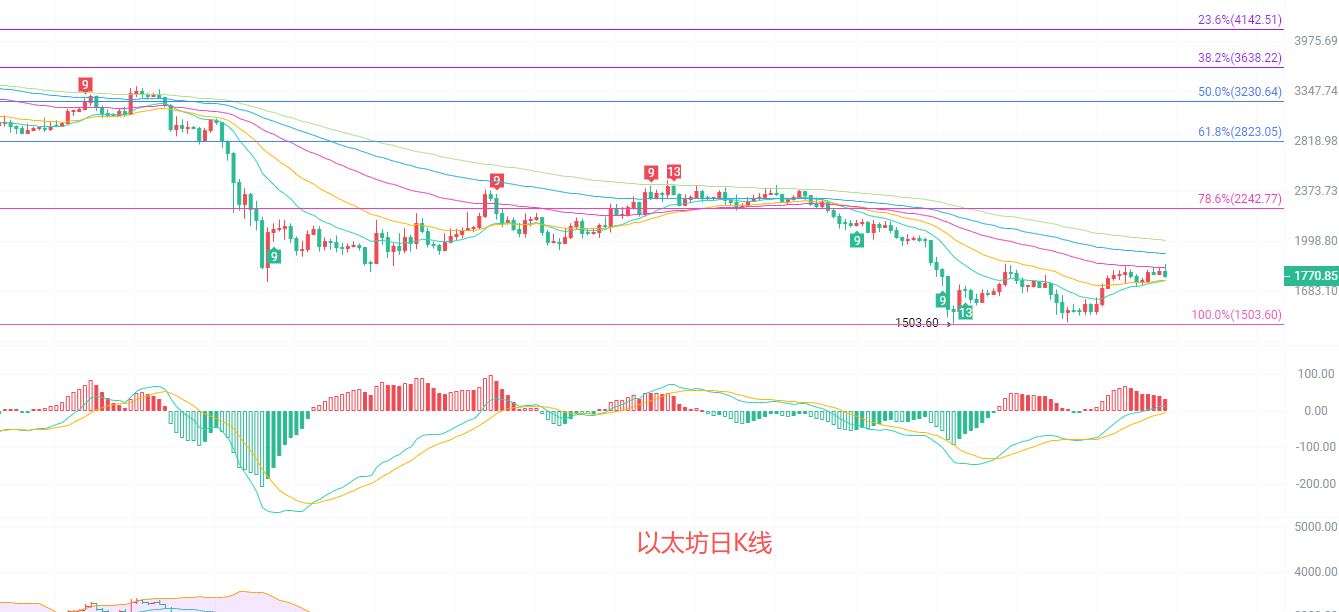
The daily candlestick is in a clear downward channel. The price is constrained by the EMA15/30 moving averages, with key support around 1747 in the short term, and overhead pressure near the EMA60 at 1827. The MACD indicator shows that the red bars are continually shortening; the DIF and DEA are about to form a death cross, and bullish momentum is gradually depleting. The middle line of the Bollinger Bands continue to decline, with prices oscillating near the lower band, indicating that the bearish trend remains unchanged, but the lower band around 1511 has strong support. There is a demand for a rebound repair in the short term, but the overall trend still leans bearish, and the height of the rebound is limited.
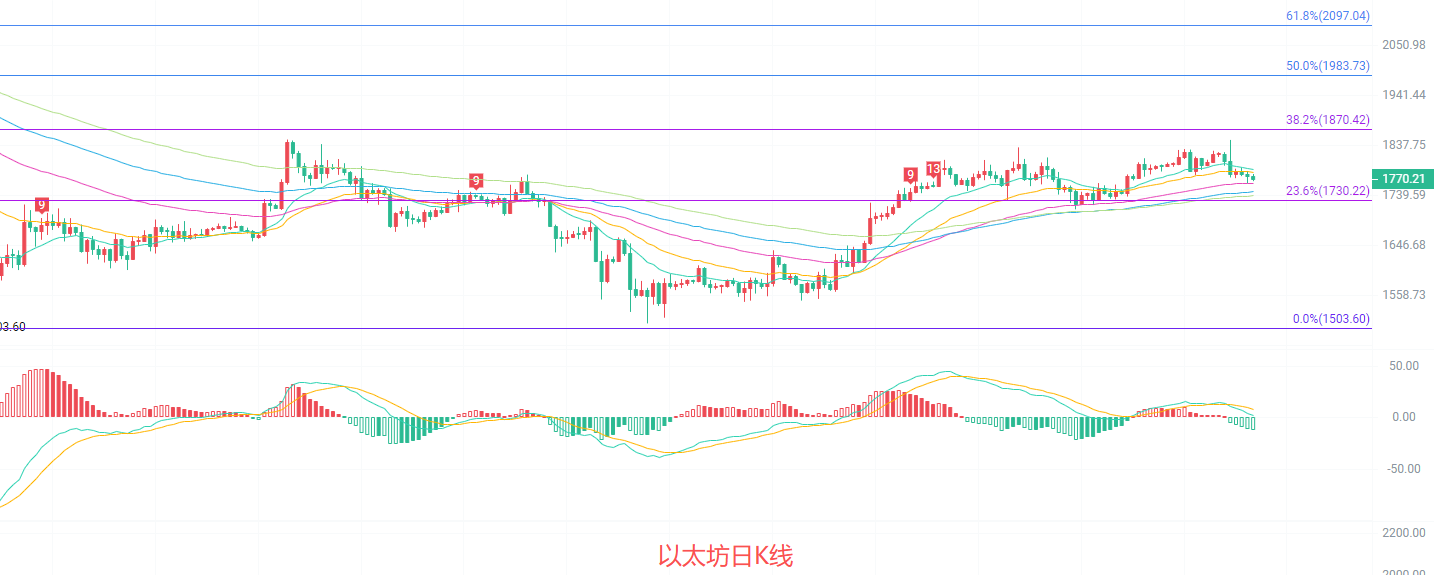
The four-hour candlestick is in a narrow oscillating range, with the EMA15/30 moving averages flattening out, establishing a short-term contention level around 1770. The MACD indicator shows the DIF breaking below the DEA, and green bars are beginning to increase, with short-term bears in dominance. The Bollinger Bands are constricting, with the upper band at 1827 and the lower band at 1767 forming a short-term oscillating range. The price has repeatedly failed to test the upper band, indicating heavy selling pressure above. The Fibonacci 23.6% level at 1730 is strong support, and the 38.2% level at 1870 is strong resistance. In the short term, the range oscillation is likely to be maintained while waiting for direction selection.
Short-term reference:
If it does not break below 1750 to 1700, buy upward, with a stop loss at 1650, targeting 1820 to 1880
If it does not break above 1830 to 1860, sell downward, with a stop loss at 1900, targeting 1780 to 1740
Specific operations should primarily refer to real-time market data. For more information details, you can consult the author. The publication of the article has a delay and suggestions are for reference only; risk is undertaken by the reader.

Warm reminder: The above content is solely created by the author for the public account. The advertisements at the end of the article and in the comments section are unrelated to the author. Please distinguish carefully, thank you for reading.
免责声明:本文章仅代表作者个人观点,不代表本平台的立场和观点。本文章仅供信息分享,不构成对任何人的任何投资建议。用户与作者之间的任何争议,与本平台无关。如网页中刊载的文章或图片涉及侵权,请提供相关的权利证明和身份证明发送邮件到support@aicoin.com,本平台相关工作人员将会进行核查。