Academician of the Crypto Circle: On July 14, Bitcoin (BTC) engages in fierce long and short battles, with daily indicators suggesting a trend reversal might be imminent? Latest market analysis and operational advice analysis
Currently, Bitcoin is at 62300, oscillating around 62000 without providing surprises for the bulls or a satisfying downturn for the bears, resembling a typical "boiling frog" market. Many people always think about capturing every fluctuation in a volatile market, only to end up getting swept out by chasing prices and stopping losses, resulting in dwindling capital. In the crypto circle, not losing is gaining; managing stop losses and controlling positions is more important than anything else. At this moment, patience is worth more than skill; before the direction is established, don’t gamble your capital on it.
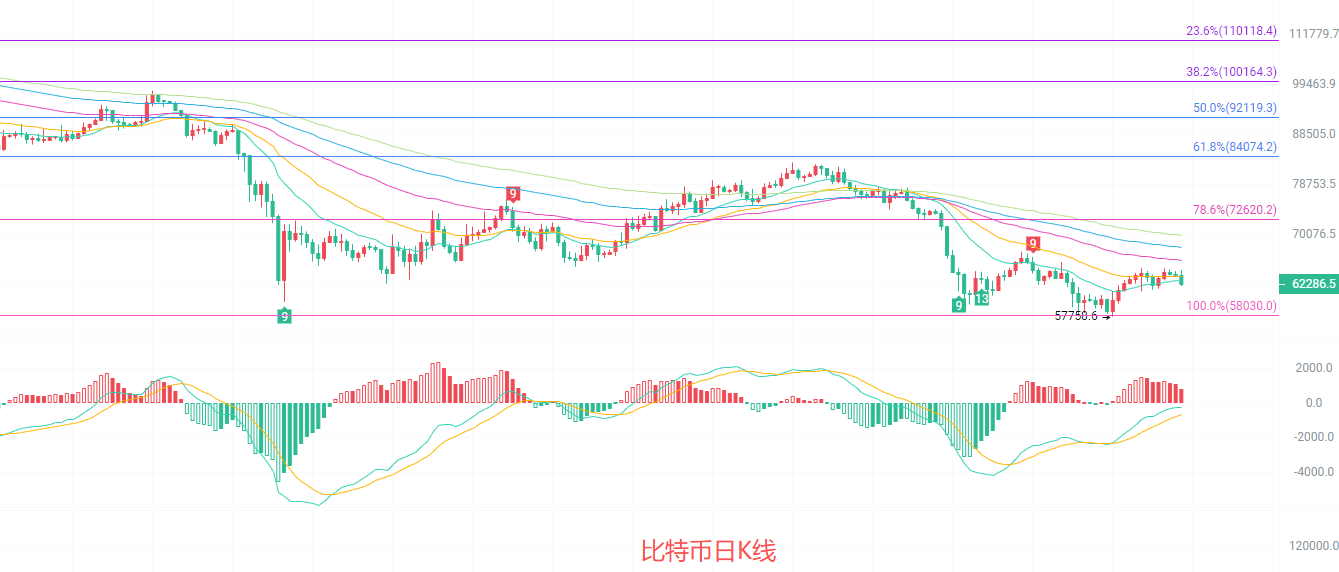
The daily K-line is overall in a weak oscillation recovery phase, with prices still under pressure below the EMA15 and EMA30 moving averages, showing insufficient short-term bullish momentum. The MACD indicator shows that DIF is still below DEA, with green bars decreasing in volume but not fully turning red, indicating that the downward momentum has not completely exhausted; the middle track of the Bollinger Bands at 61844 forms weak support, while the upper track at 65320 and previous high points form dual pressure, overall maintaining a bearish structure without fundamental reversal.
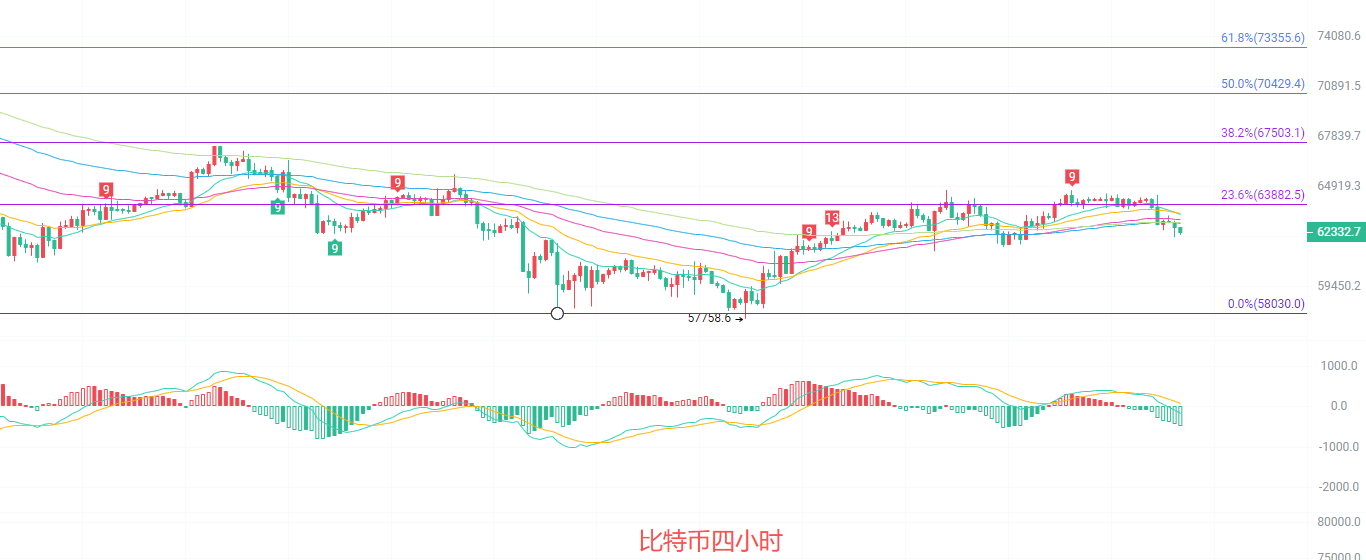
The four-hour K-line is below the EMA15, with short-term moving averages in a twisted state, leading to a deadlock in long and short battles. The MACD's DIF and DEA continue to decline, with green bars increasing in volume, indicating that short-term bearish strength is beginning to intensify; the middle track of the Bollinger Bands at 63716 exerts pressure on prices, while support around the lower track at 62494 is facing a test. At the same time, the price is below the Fibonacci 23.6%, indicating that the rebound momentum is limited, and a continuation of weak range oscillation is highly probable in the short term.
Short-term reference:
If the price does not break below 62000 to 61000, it may rise, with a stop loss at 60500 and a target of 63000 to 64000.
If the price does not break below 63500 to 64000, it may drop, with a stop loss at 64500 and a target of 62500 to 62000.
Specific operations depend on real-time market data; for more detailed information, you can consult the author. There may be a delay in the article release, and it is suggested for reference only, with risks borne by readers.

Friendly reminder: The above content is only created by the author on the official account. Advertisements at the end of the article and in the comments section are unrelated to the author. Please identify carefully, and thank you for reading.
免责声明:本文章仅代表作者个人观点,不代表本平台的立场和观点。本文章仅供信息分享,不构成对任何人的任何投资建议。用户与作者之间的任何争议,与本平台无关。如网页中刊载的文章或图片涉及侵权,请提供相关的权利证明和身份证明发送邮件到support@aicoin.com,本平台相关工作人员将会进行核查。