Cryptocurrency Expert: On July 12, Ethereum (ETH) double-line resonance, has the market turning point quietly emerged? Latest market analysis reference
The current price of Ethereum is 1818, and the market will not give you money just because you panic. This position is neither up nor down; chasing long positions may lead to losses, chasing shorts may lead to missing out. The best thing to do is to restrain yourself. Don’t gamble your living expenses, don’t use leverage to bet on tomorrow, and don’t get jealous just because we moved northward below 1650. In the cryptocurrency circle, most people lose not because the direction is wrong, but because there is no discipline. Set stop losses, follow the plan, and don’t let emotions lead you away.
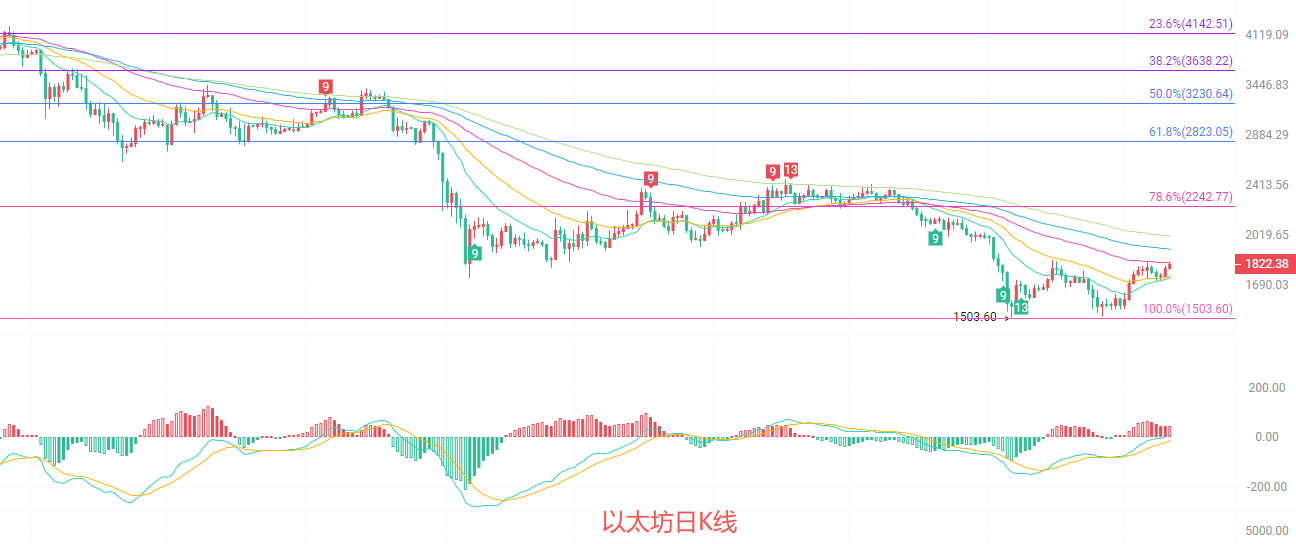
The daily K-line has risen above the EMA15 and EMA30 short-term moving averages, positioned within the rebound channel since the low of 1503. The MACD indicator's red bars continue to expand, and the DIF crosses above the DEA; northward momentum is gradually being released. The middle track of the Bollinger Bands is flat, with short-term pressure near the upper track at around 1869, and strong support at the lower track at 1509. The Fibonacci 78.6% position at 2242 remains a key resistance above, with the current price in the early stages of rebound. Although the southward arrangement of the moving averages has not completely reversed, the short-term downward trend has obviously slowed, and the trading volume is gently increasing, indicating the possibility of continuing the rebound.
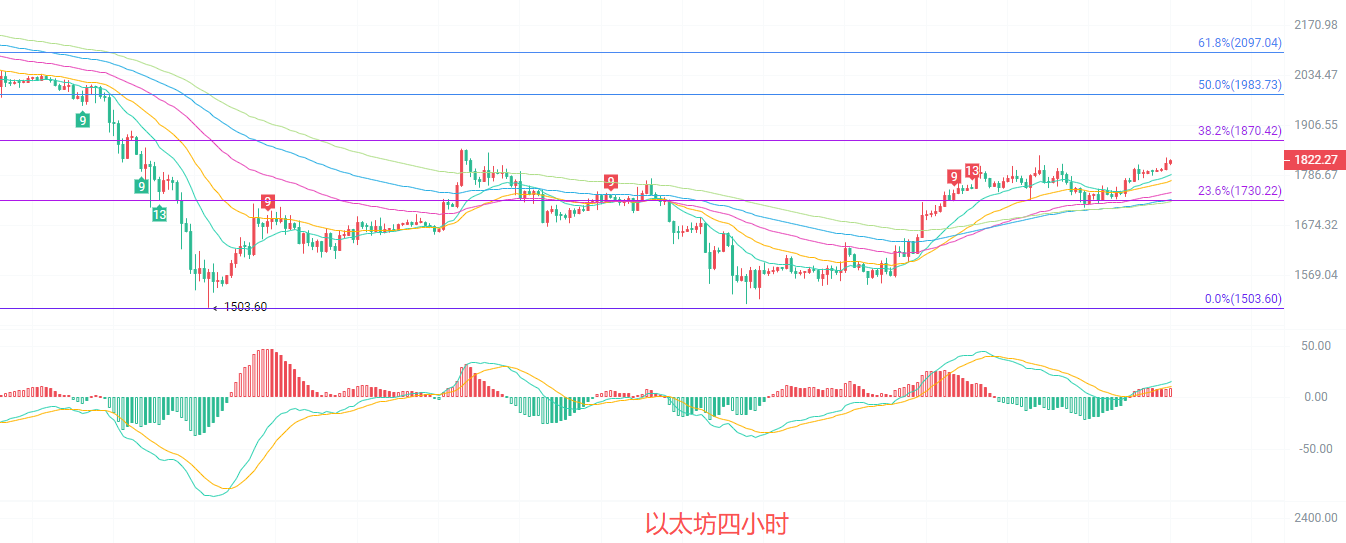
The four-hour K-line operates along the upper track of the Bollinger Bands, firmly standing above all short-term moving averages like the EMA15 and EMA30, with moving averages showing a northward arrangement, forming upward support. The MACD red bars have slightly shortened, and the DIF remains above the DEA; although the northward momentum is weakening, it has not reversed. The Bollinger Bands are opening upwards, with short-term pressure near the upper track at around 1830, and strong support at the lower track at 1710. The Fibonacci 23.6% position at 1730 has been broken, currently positioned at the upper boundary of the 1730-1830 range. The short-term is mildly bullish but faces slight pullback pressure; if the moving average support is not broken during the pullback, there is still upward momentum.
Short-term reference:
If it does not break below 1750 to 1700, it can move north; stop loss at 1650, target aiming at 1820 to 1880.
If it does not break above 1830 to 1860, it can move south; stop loss at 1900, target aiming at 1780 to 1740.
Specific operations should primarily rely on real-time market data. For more information, please consult the author. The publication of this article may be delayed; it is recommended for reference only, and risks are borne by the individual.

Friendly reminder: The above content is solely created by the author on the public account. The advertisements at the end of the article and in the comments section are unrelated to the author. Please be cautious in distinguishing them, thank you for reading.
免责声明:本文章仅代表作者个人观点,不代表本平台的立场和观点。本文章仅供信息分享,不构成对任何人的任何投资建议。用户与作者之间的任何争议,与本平台无关。如网页中刊载的文章或图片涉及侵权,请提供相关的权利证明和身份证明发送邮件到support@aicoin.com,本平台相关工作人员将会进行核查。