Cryptocurrency Circle Academician: Is the North-South Watershed Position for Bitcoin (BTC) on July 12 Clearly Visible? Latest Market Analysis and Operational Suggestions Explained
Currently, Bitcoin is around 64000, the market is fluctuating around 64000. To put it bluntly, it’s a tug-of-war between the bulls and the bears. In this situation, emotional trading is the most taboo; chasing after rises and cutting losses during drops can easily lead to being liquidated back and forth. We small retail investors do not covet the myth of getting rich overnight; we just need to follow our trading plan, manage stop losses well, control our positions, and staying alive is more important than anything else. The market is always full of opportunities; what it lacks is those who can patiently wait for opportunities. We can hold long positions near 60000 without rushing to exit.
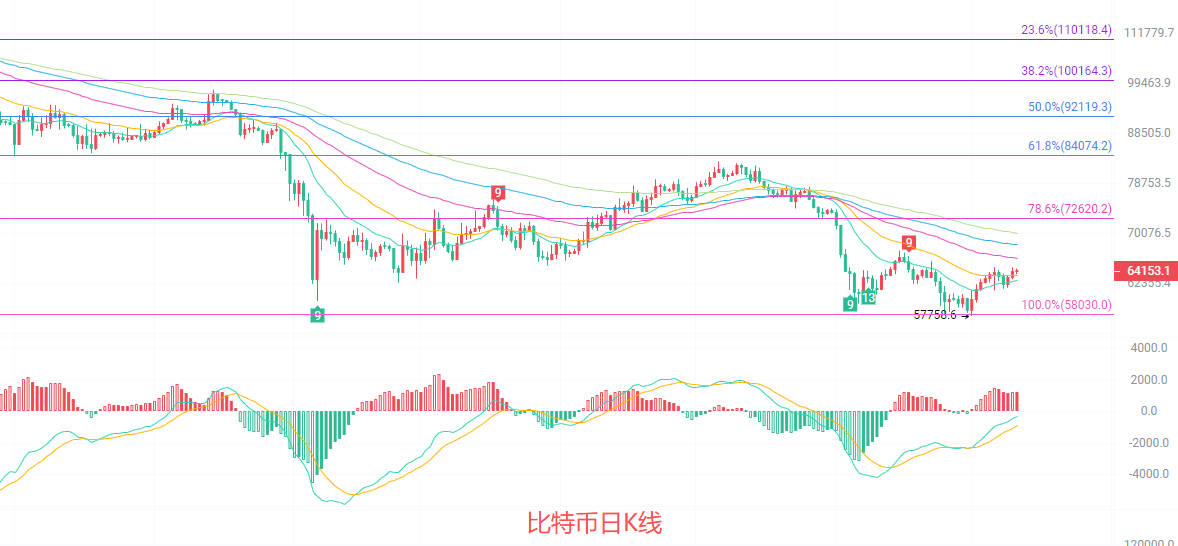
The current price on the daily K-line is supported by the EMA15 and EMA30 moving averages, while the EMA60 moving average above is forming short-term resistance. In the MACD indicator, the DIF has crossed above the DEA, and the red bars continue to expand, indicating a slight recovery in bullish momentum. However, the upper band of the Bollinger Bands is at 65449, with space above the middle band 61892. The 100% Fibonacci retracement level at 58030 is strong support below, while the 78.6% level near 72620 is a key resistance level, and overall it is in the rebound repair phase after a decline.
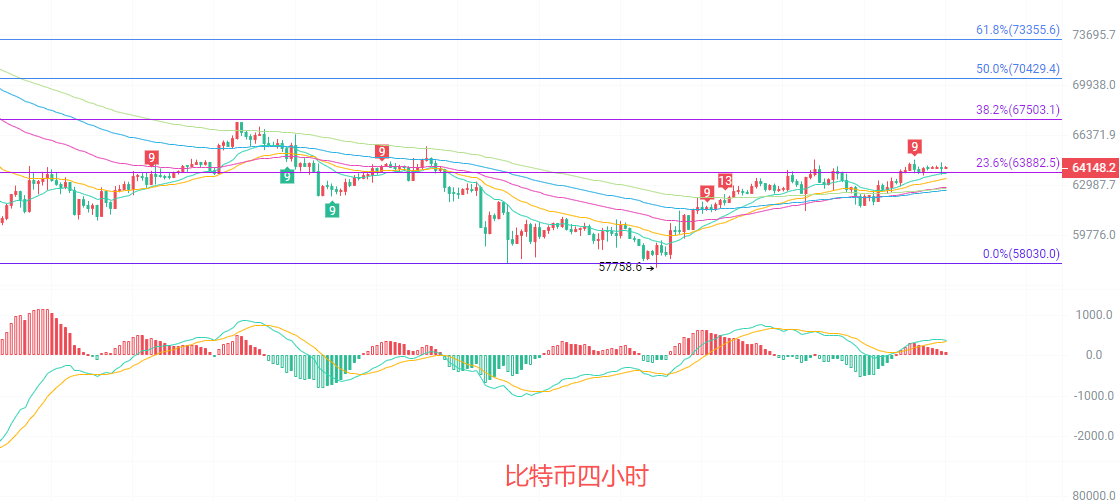
On the four-hour K-line, the price is steadily above the EMA15, EMA30, and EMA60 moving averages, forming a bullish arrangement with a short-term trend leaning strong. In the MACD indicator, the DIF continues to operate above the DEA, the red bars have shrunk but still maintain positive values, and while bullish momentum has weakened, it has not reversed. The Bollinger Bands are currently narrowing, with the price running above the middle band at 63405, facing short-term resistance near the upper band at 65087, while the lower band at 61722 forms support; overall it is in a range-bound state leaning towards the upper end.
Short-term reference:
If it does not break below 63500 to 63000, it can move upwards, with a stop loss at 62500 and a target of 64500 to 65500.
If it does not break above 65000 to 65500, it can move downwards, with a stop loss at 66000 and a target of 64000 to 63500.
Specific operations should focus on real-time market data. For more detailed information, you can consult the author. There may be delays in the article publication, and the suggestions are for reference only. Risks are to be borne by the reader.

Friendly reminder: The above content is solely created by the author of the official account. The ads at the end of the article and in the comments section are unrelated to the author. Please discern carefully, thank you for reading.
免责声明:本文章仅代表作者个人观点,不代表本平台的立场和观点。本文章仅供信息分享,不构成对任何人的任何投资建议。用户与作者之间的任何争议,与本平台无关。如网页中刊载的文章或图片涉及侵权,请提供相关的权利证明和身份证明发送邮件到support@aicoin.com,本平台相关工作人员将会进行核查。