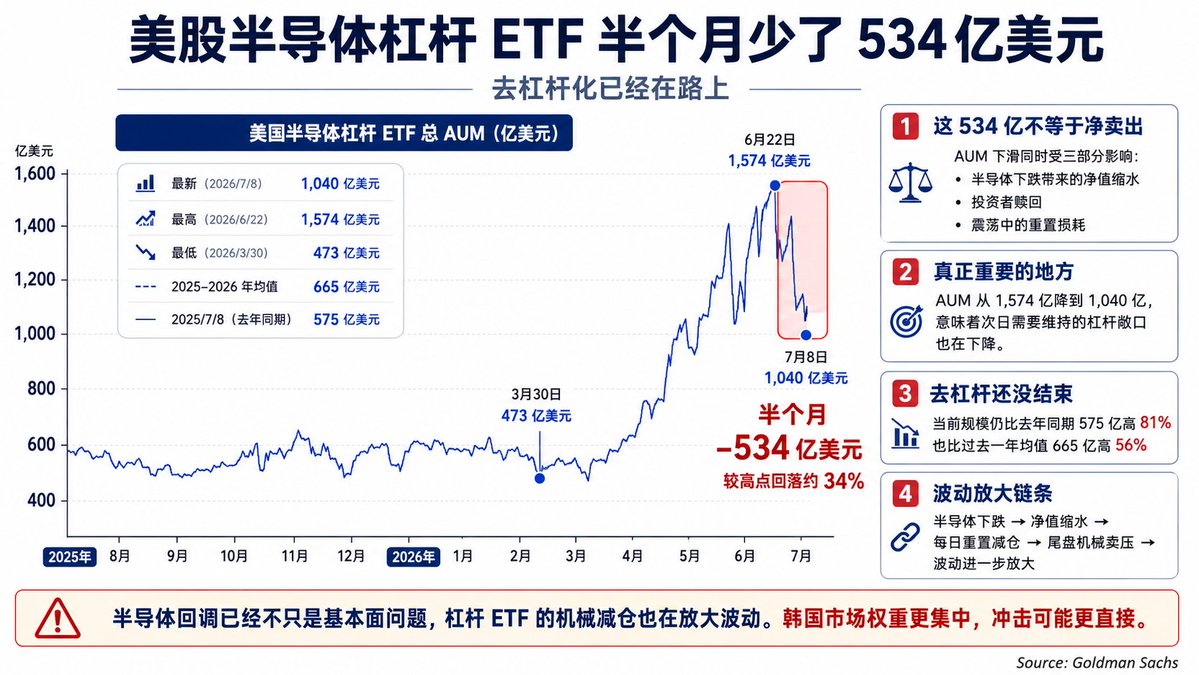
The US semiconductor leveraged ETF has seen a decrease of $53.4 billion in half a month, indicating that deleveraging is already underway.
Previously, I mentioned that the daily rebalance of leveraged ETFs has become an amplifier of short-term fluctuations in US stocks. Now, the scale of the semiconductor leveraged ETFs has noticeably dropped.
The total scale of the US semiconductor leveraged ETF was only $47.3 billion on March 30, and it surged to $157.4 billion by June 22. In less than three months, it increased by $110.1 billion, a growth of 233%.
By July 8, the scale had already fallen to $104 billion. In half a month, it lost $53.4 billion, a pullback of nearly 34%.
Please note that the $53.4 billion decrease in half a month represents a shrinkage in the total assets under management (AUM) of the leveraged ETFs, and it does not mean that investors net sold $53.4 billion.
AUM is affected by both the net asset value (NAV) of the funds and capital flows. Following the drop in semiconductors, the NAV of 2x and 3x products will amplify the decline. Even if investors do not redeem a penny, the fund size will significantly decrease. If combined with investor redemptions and NAV losses during turbulent markets, the AUM will decline even faster.
Currently, this set of data alone cannot deduce how much actual net capital has flowed out, but the decrease in fund size from $157.4 billion to $104 billion means that the leveraged exposure that needs to be maintained the next day is also decreasing. The actual deleveraging could be far higher than $53.4 billion.
To put it plainly, the US semiconductor sector is undergoing a clear deleveraging.
For every $1 of funds managed by leveraged ETFs, there could be corresponding exposures of $2 or $3 in stocks, futures, and swaps. With a remaining management scale of $104 billion, the directional exposure could still exceed $200 billion.
After the semiconductor decline, the NAV of the leveraged ETFs has shrunk, and investors have begun redeeming while the fund must continue to reduce exposure according to daily resetting rules. Active reduction, redemptions, and mechanical selling combine, causing funds that previously accelerated upward to now accelerate downward.
What’s even more noteworthy is that this round of deleveraging is not yet fully concluded.
The current management scale of $104 billion is still 81% higher than $57.5 billion at the same time last year and 56% above the average scale of $66.5 billion over the past year.
In other words, although it has already dropped by one-third from its peak, the funds in the semiconductor leveraged ETFs remain at a high level. As long as semiconductors continue to drop, the pressure for mechanical reduction will keep appearing.
Even if semiconductors do not decline significantly again, as long as volatility remains high, the daily losses from the resetting of leveraged ETFs will continue to accumulate. Investors seeing continued underperformance in NAV may easily continue redeeming, and after the fund size decreases, this will lead to further contraction of exposure.
Therefore, the recent significant volatility in semiconductors cannot be explained solely by earnings reports and fundamentals.
Professional funds and hedge funds are reducing positions, while retail investors had massively chased prices through leveraged ETFs earlier. After the trend reversal, institutional selling, retail redemptions, and the rebalancing of leveraged products will occur simultaneously, especially around market close, making it easy to turn normal pullbacks into larger fluctuations.
The risks in the Korean market may be more direct.
The US semiconductor leveraged ETFs have already begun deleveraging, and the concentration in the Korean market is highly focused on Samsung Electronics, SK Hynix, and a few semiconductor companies, with market depth far less than that of the US. The reduction pressure from the drop in US semiconductors will transmit through the memory and AI supply chain to Korea, further amplified by Korea's own leveraged ETFs.
@Gate Crypto, US stocks, Hong Kong stocks, Korean stocks, gold, CFD, one-stop trading for prediction markets
免责声明:本文章仅代表作者个人观点,不代表本平台的立场和观点。本文章仅供信息分享,不构成对任何人的任何投资建议。用户与作者之间的任何争议,与本平台无关。如网页中刊载的文章或图片涉及侵权,请提供相关的权利证明和身份证明发送邮件到support@aicoin.com,本平台相关工作人员将会进行核查。


