I used xBubble to manually create two US stock tools, let's talk about the ideas.
Recently addicted to US stocks, I created two websites using @dappOS_com's xBubble, both related to US stocks, sharing a bit.
1. Stock God Dashboard
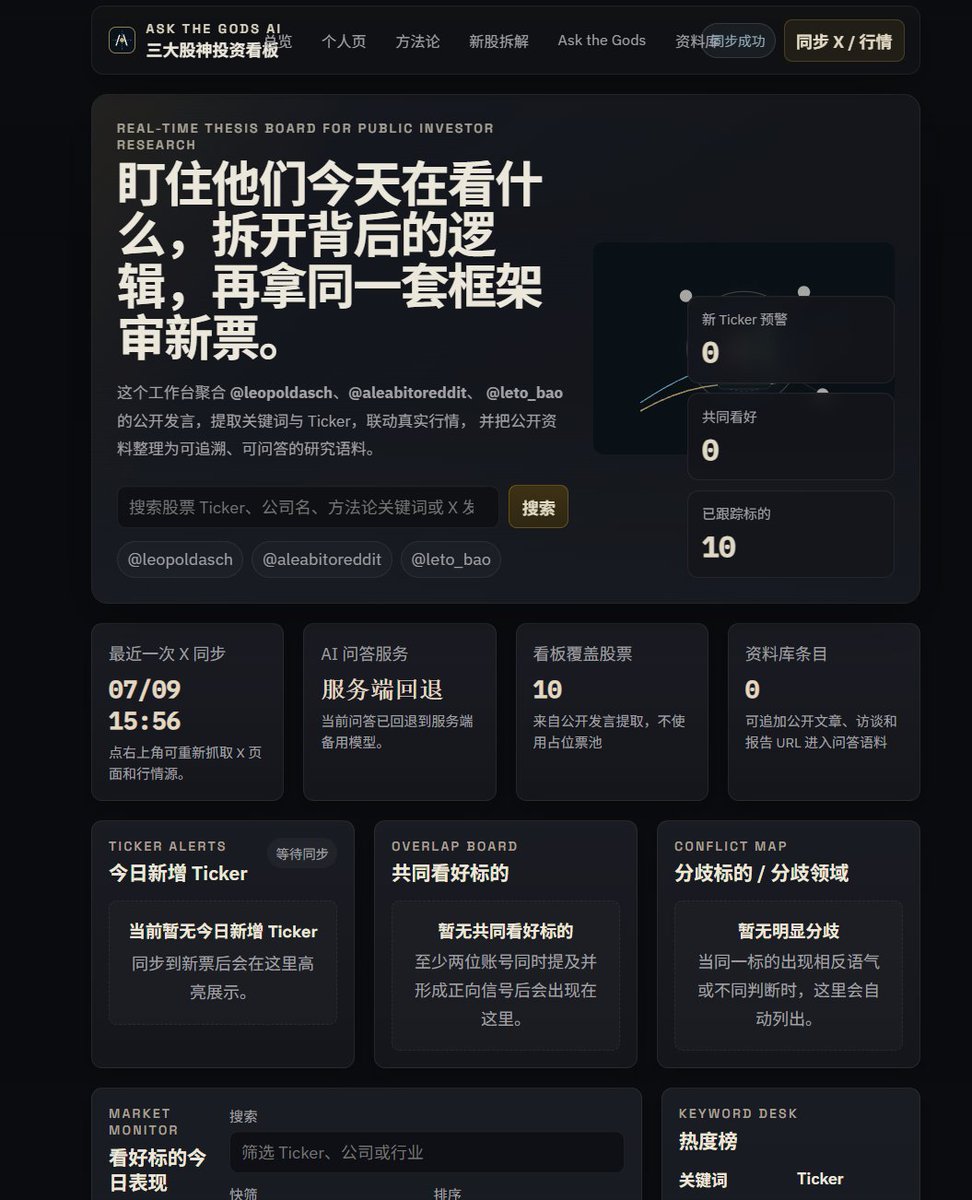
I made a visual dashboard of the public statements from three stock gods:
@leopoldasch
@aleabitoreddit (White Hair Stock God)
@leto_bao (Byte Stock God)
The website automatically scrapes their statements, extracting Ticker and core viewpoints.
What can it do?
① Viewpoint Aggregation
Real-time capturing of the three's statements on X.
② New Ticker Alerts
As soon as a previously unrecorded new asset is mentioned, it will be highlighted and alerted.
③ Consensus and Divergence
Automatically statistics: which stocks are favored by all three, where do pairs find consensus, and where are the divergences.
④ Market Linkage
The tracked stocks will display their daily performance and recent trends simultaneously.
⑤ Methodology Breakdown
Organize the investment frameworks of the three: investment philosophy, stock selection methods, judgment logic, and a ready-to-use checklist.
⑥ New Stock Logic Analysis
Input any Ticker, the system will generate an analysis report based on the thoughts of these three.
⑦ Ask the Gods AI
Based on accumulated public information, it performs RAG enhanced Q&A.
Web link🔗 https://cm-f22def67eb6e2cd2-site-923286f0cb2e.bubbleupdappos.workers.dev/
2. Disclosure Radar
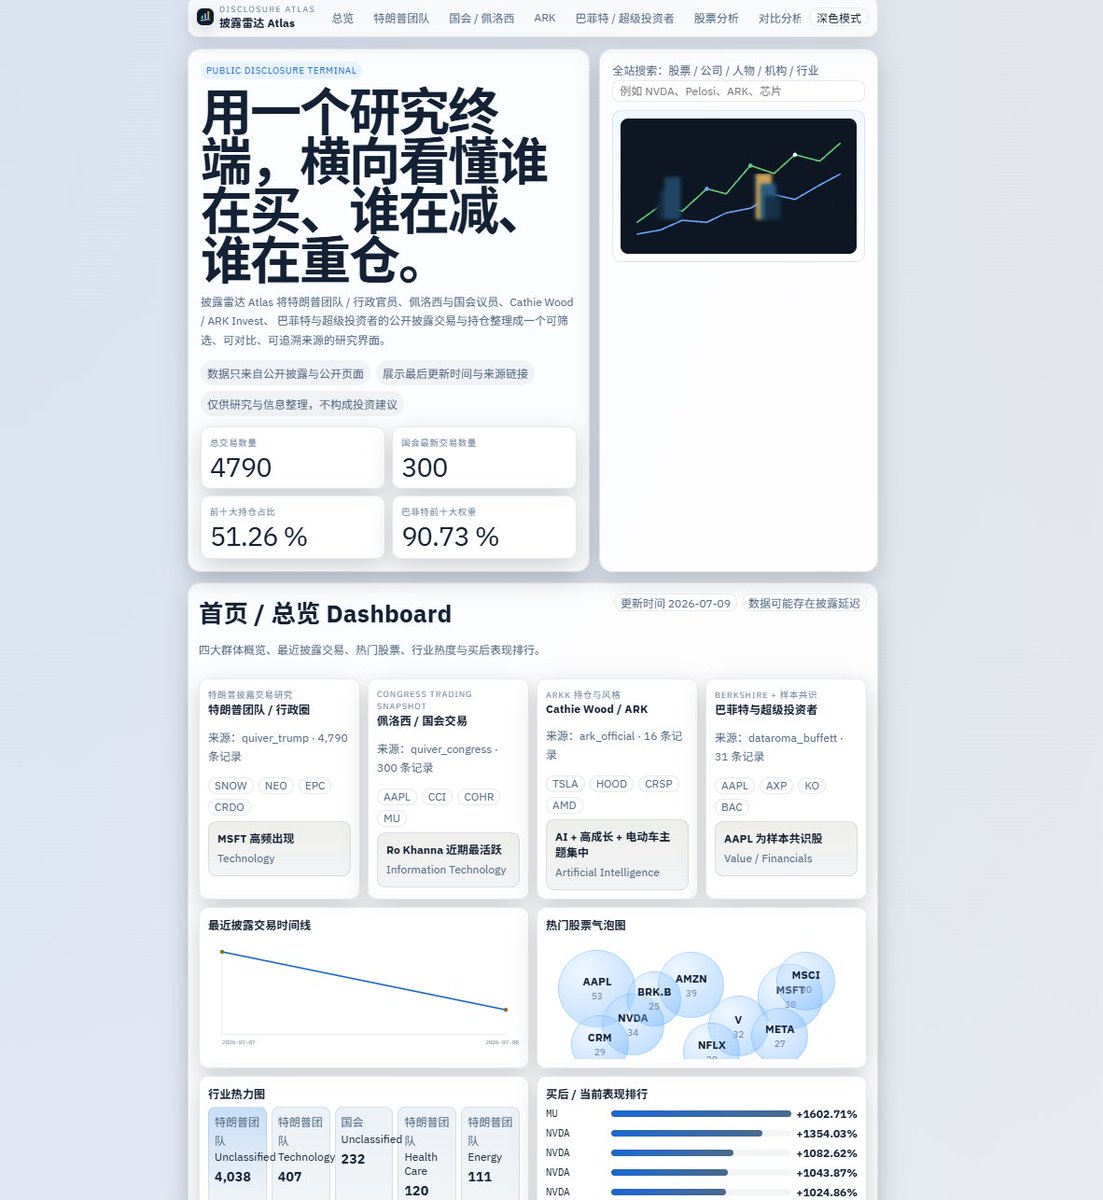
This is a visual financial research tool specifically aggregating publicly disclosed trading and holding data, covering four categories of high-focus subjects.
▌ Trump Team / Government Officials
▌ Pelosi and Congress Members
▌ Cathie Wood / ARK Invest
▌ Buffett and Other Super Investors
It is not a stock recommendation tool, but rather aims to help you answer several questions on the same interface:
What have they recently bought, and what have they sold?
Which stocks are being concentrated traded or held by multiple "smart money" groups?
How has the stock price generally performed after the disclosed purchases?
Is there any overlap in holdings among different groups? Is the investment style diverging?
This data is not actually scarce, it has just been long scattered across various websites. What I am doing is connecting these four sources into a more convenient research pathway.
Web link🔗 https://cm-f22def67eb6e2cd2-site-7d3ca9ad5d3d.bubbleupdappos.workers.dev/#compare
Why choose xBubble?
The user experience of traditional AI tools often feels like throwing users into a maze:
Select a model → then piece together tools → then adjust prompts → then test repeatedly
Each step has its barriers.
xBubble does things differently. It not only helps you try and document task-level SOPs, but more importantly, it can understand a user’s very brief request and then automatically dispatch suitable specialized solutions. This is exactly the advantage DAPPOS has been laying out and consolidating.
In the past, when playing US stocks, I always had to switch between multiple platforms, manually verifying data. Now, AI directly helps me aggregate viewpoints, track trends, and assist in decision-making.
Technical capabilities should not belong only to a few who can "tame tools,"
they should belong to everyone who can clearly say "what I want."
免责声明:本文章仅代表作者个人观点,不代表本平台的立场和观点。本文章仅供信息分享,不构成对任何人的任何投资建议。用户与作者之间的任何争议,与本平台无关。如网页中刊载的文章或图片涉及侵权,请提供相关的权利证明和身份证明发送邮件到support@aicoin.com,本平台相关工作人员将会进行核查。


