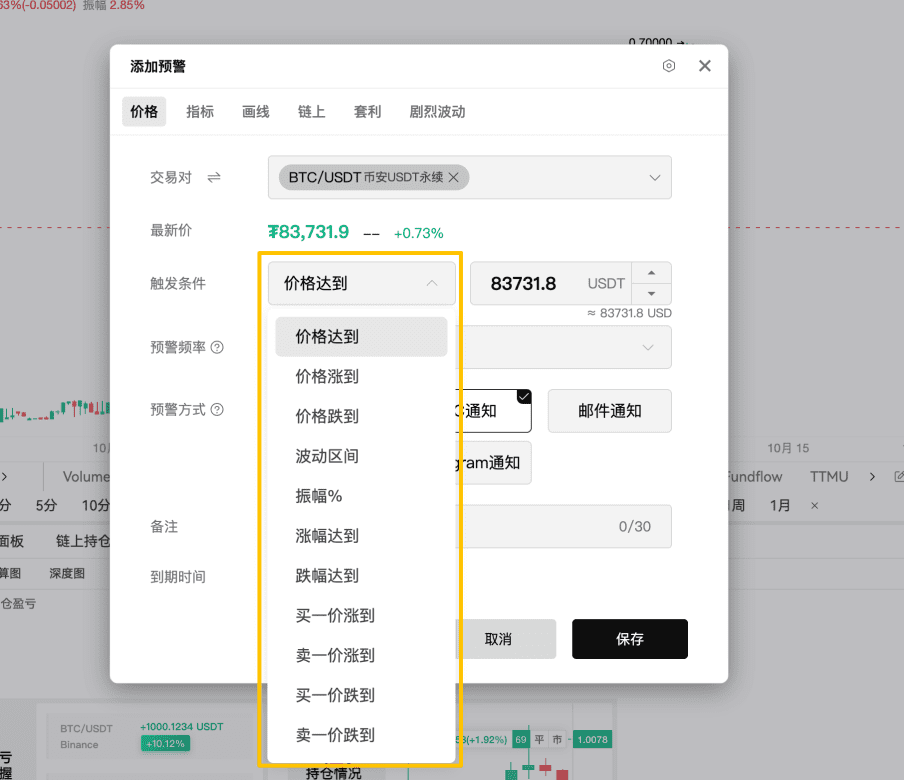
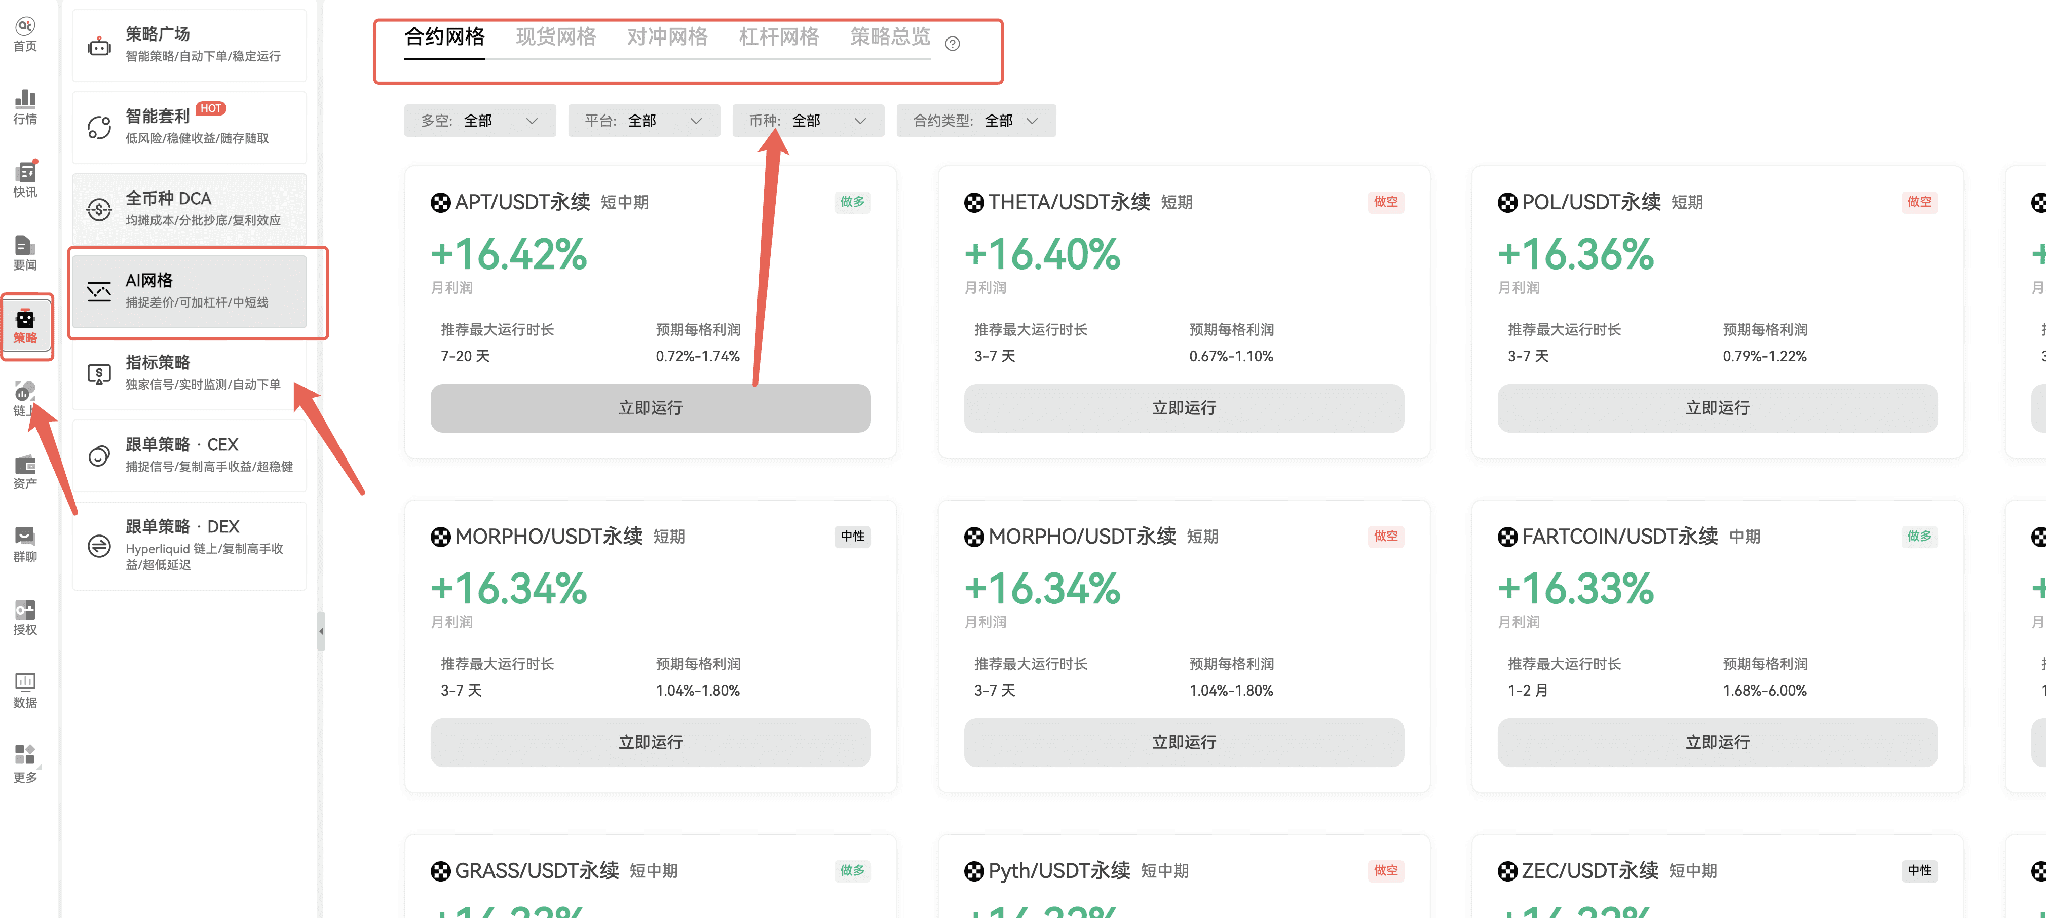
The recent market trend is basically driven by news, changing narratives every day. Just as the market digested the negative impact of MicroStrategy's large-scale coin sale, Trump turned around and expressed a bullish sentiment, which caused the price to rebound; when the tensions around the US-Iran conflict intensified, the narrative of geopolitical risk resurfaced, pushing oil prices up by 5%-6% in a single day, while European markets and US stocks weakened simultaneously, leading Bitcoin to fall below 62,000 points. Many people focus on K-line fluctuations, trading volumes, or the large buy or sell orders in the order book, thinking they represent support or resistance. However, they often find the opposite to be true — despite seeing large buy orders, the price still drops; despite seeing volume, which they think indicates a breakout, the market reverses and traps them. The core issue lies in their inability to distinguish between active orders and passive orders, failing to understand where the real guiding funds in the current market are flowing.
Two core news areas: The market's response has quietly changed
Let's first discuss the news that everyone cares about. Recently, two variables are particularly noteworthy, and the market's reaction has differed from before.
The first is MicroStrategy's coin sale. On Monday evening, MicroStrategy announced it sold nearly 3,600 BTC, cashing out $216 million. The market indeed took a step down when the news broke that night. However, it's worth pondering: back in May and June, when news came out that MicroStrategy sold 32 BTC, the market dropped sharply; this time, selling thousands didn’t cause the expected volatility. This is actually a signal worth noting — the negative expectations have been priced in by the market. People anticipated that there would be a sale, so the selling pressure was much weaker than before. The key point to watch next Monday will be their actions, based on their usual practice of "bidding to sell, then buying back at a premium." Whether they will buy back and how much will be a key factor affecting short-term sentiment.
The second is the rekindled US-Iran conflict. The geopolitical narrative has returned; oil, as the most directly benefited commodity, has risen significantly in a single day, leading to a retreat in market risk appetite, with European markets and US stocks both weakening, putting pressure on the cryptocurrency market as well. The characteristic of such events is that the shocks are swift and the volatility is high, but their sustainability is often questioned, requiring close tracking to see if the situation escalates or cools down. It's important to note: whether it's Trump calling for bullish sentiment or geopolitical negatives, the effect of news is always a short-term shock. Many times, there’s a sharp rise or a steep drop, but it doesn’t last. What truly determines whether a trend can continue is never the news itself but whether funds are backing it up, if there is sustained active buying.
The pit that 90% of people fall into: Don't take passive orders as real strength
Many people have a deep-seated misconception when observing the market: seeing large buy orders in the order book leads them to believe there is strong support; seeing large sell orders makes them think there's significant pressure. However, actual market movements often contradict this; large buy orders can still lead to price drops, while large sell orders can result in price increases. The issue lies in the fact that most visible orders are passive orders, which only represent "willingness to transact at this price" and do not mean "it will definitely dictate the market." For example, if there is a buy order of over $80 million for Bitcoin at the 61,000 position, nearly 1,400 BTC, it may seem like strong support. But this is just a passive buy order, waiting for someone to sell to it, indicating there is someone willing to take the order at this level, but does not mean they will actively drive the price up. What’s even more concerning is those large orders that are "repeatedly placed and canceled."
For example, if a buy order initially placed near 60,500 moves up to 61,000 over time, placed for three to four hours before being canceled, then reappearing at a different location, this is likely a form of "false support," creating an illusion for retail investors that "someone is propping it up." When the market actually drops, the cancellations happen faster than anyone else. To determine whether such large orders are effective, don't just look at whether they are placed; check who the takers are after execution: was it an active sell order that took out the buy order, or an active buy order that consumed the sell order? The latter represents real strength.
In contrast to passive orders, there are active orders — funds that actively transact at market prices, consuming hanging orders. If active sell orders dominate, there is substantial selling pressure driving proceedings; if active buy orders dominate, it means real capital is pushing upwards. The trading volume we usually observe is merely the total of all buy and sell transactions, fundamentally failing to distinguish who is active and who is passive. This is why many times, when trading volume spikes, people expect a breakout, only to find that the market drops instead — because behind that volume, active sell orders are ruling, while the buy orders are all passive, unable to sustain price levels.
One indicator to understand active funds: Four practical cases to explain usage
To gain a clearer view of active order direction, I developed an active funds net inflow indicator, which operates on a simple logic: it uses the volume of active buys minus the volume of active sells, yielding the net inflow or outflow of active funds. Green columns indicate stronger active buy orders and net inflow of funds, while red indicates stronger active sell orders and net outflow of funds. There's no need to stretch K-lines to view complex footstep charts; it's easy to see who is currently leading the market. Friends who want to write this themselves can simply find the corresponding functions for active buy and sell in the function library and subtract them to get results. Those who don’t know how to do this can join the live Q&A discussions in our community to ask me. Concepts alone are too abstract; let's couple them with some recent practical cases for better understanding. 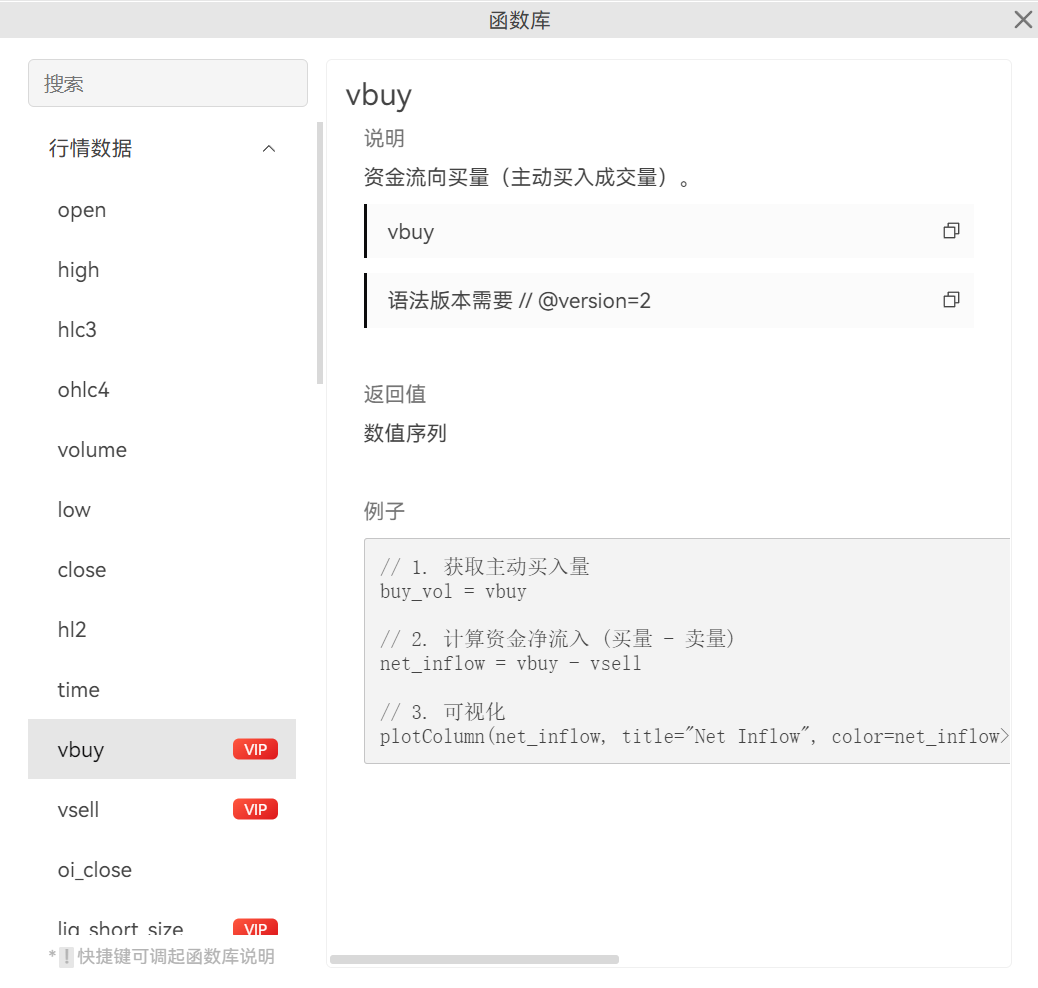
// @version=2
// Create your custom script here
// 1. Get active buy/sell volume
buy_vol = vbuy
sell_vol = vsell
// 2. Calculate net inflow of funds (buy volume - sell volume)
net_inflow = vbuy - vsell
// 3. Visualization
plotColumn(net_inflow, title="Net Inflow", color=net_inflow<0?"#f23838":"#61f261", fill=true, display=true, offset=0, showLast=-1, excludeRange=false)
//plot(buy_vol)
//plot(sell_vol)
Case 1: A hammer candlestick does not necessarily indicate stability; watch the active funding
During the downturn in the early morning, a hammer candlestick with a long lower shadow was formed, still a bullish candle. Many looked at it and thought, “The bottom has risen; I can buy at the bottom.” However, checking the active funds indicator shows that red columns dominated throughout, with active sell orders prevailing, indicating there was no reversal. Although two small bullish candles followed, seemingly indicating buy support, active buy orders never gained an advantage; they merely propped up the price briefly without forming a countering force. This is a typical case of "false stabilization," and it is highly probable that the price would continue to drop thereafter.
Case 2: Why does a $10 million sell order not lead to a price drop but instead an increase?
Another classic counter-example: a $66 million large sell order appeared in the order book, consisting of 1,072 BTC, looking heavily pressured, logically suggesting a significant price drop. Yet, after executions, the price not only did not drop but rather rose. The reason is simple: this sell order was a passive one, while its counterpart — the active buying power—far exceeded the volume of this sell order. According to the funds indicator, at that moment, the active buy volume was greater than the sell volume, indicating net inflow of funds, which meant the selling pressure was fully absorbed by the market. In such scenarios, those intimidating large sell orders end up being chips for the leading players to accumulate.
Case 3: Why can't a $200 million support order hold the price?
On the night of MicroStrategy's coin sale on Monday, there was also a $200 million contract long order placed as support that lasted for a full 7 hours, appearing to be an unbreakable support. But in the end, the price still dropped. The core issue was that the intensity of active selling pressure far surpassed the strength of the passive support order. At that time, active selling exceeded active buying by more than 5,000 BTC, amounting to over $300 million in active sell pressure, far exceeding the amount of the hanging support order. Passive buy orders can only wait to be knocked down; they do not propel prices upward. When active selling keeps coming in, no matter how thick the support order, it cannot hold the price.
Case 4: The rebound triggered by news; sustainability depends on funds
When Trump expressed bullish sentiment, the price quickly rose, and many immediately thought, “It's just another short-term fluctuation; buying in will lead to losses.” At this point, there's no need to guess; just observe the active funds. During that rebound, there was sustained net inflow of active funds, with green columns appearing continuously, indicating that it was not retail investors chasing a spike, but that active funds were steadily absorbing the selling pressure above. Under such circumstances, the rebound is likely to have continuity, eventually rising nearly 6% from its low. Even if the buying pressure weakens at some point, the overall state remains of net inflow, allowing further upward movement after some consolidation.
Case 5: A true stabilization signal is that sell pressure must first weaken
Looking at the recent rebounds, it followed a very standard and healthy stabilization rhythm. First, the major player actively sold off, and the appearance of a bullish candle indicated there was buying support below, but that was not enough. The key is in the subsequent few candlesticks, where the strength of active selling gradually weakened, with red columns growing shorter, followed by active buying starting to gain strength, while green columns increased in height. Sell pressure first wanes, then buy orders fight back; in the interplay of diminishing and increasing forces, the trend slowly reverses. This signal is far more reliable than only looking at one bullish candle or a hammer candlestick.
Practical reminders and market judgment
Finally, a few practical reminders and observations regarding the current market. This active funds indicator shows its strongest relevance in the large cycles of spot markets, while assets on smaller exchanges are better viewed through smaller cycles. As long as it’s mainstream currencies or popular coins with active data, it can aid in your judgments. It does not directly signal buy or sell actions but provides a perspective — it helps you see the real financial power behind the market, especially at key support and resistance levels, during large bullish or bearish candlestick patterns, or when large orders appear, enabling you to discern genuine breakouts from traps, as well as real support from false bottoms.
As for the current market, I personally lean towards the view that it is merely a rebound and not a reversal at this point. For the short term, the lower support looks to be in the 58,000-60,000 range, and if it effectively breaks below 55,000, we should be cautious of deeper adjustments; key resistance to watch above is in the 63,000-63,800 range, which is a previous area of dense trading and also the core point for this wave of selling pressure. Whether we can break through effectively here will determine how high the rebound can go. In conclusion, news is always the spark while funds are the root cause. Don't be led by order book placements or K-line shapes; understanding the direction of active funds will help you avoid those "seemingly safe" pitfalls.
We are streaming live every day, and you are welcome to follow along continuously, dear AiCoin friends! Reserve your spot first👇
https://www.aicoin.com/zh-Hans/live/list?tab=upcoming
Join our community to discuss and become stronger together!
Official Telegram community: https://t.me/aicoincn
AiCoin Chinese Twitter: https://x.com/AiCoinzh
This article represents the author's personal views and does not reflect the platform's stance or views. This article is for information sharing only and does not constitute any investment advice to anyone.
免责声明:本文章仅代表作者个人观点,不代表本平台的立场和观点。本文章仅供信息分享,不构成对任何人的任何投资建议。用户与作者之间的任何争议,与本平台无关。如网页中刊载的文章或图片涉及侵权,请提供相关的权利证明和身份证明发送邮件到[email protected],本平台相关工作人员将会进行核查。