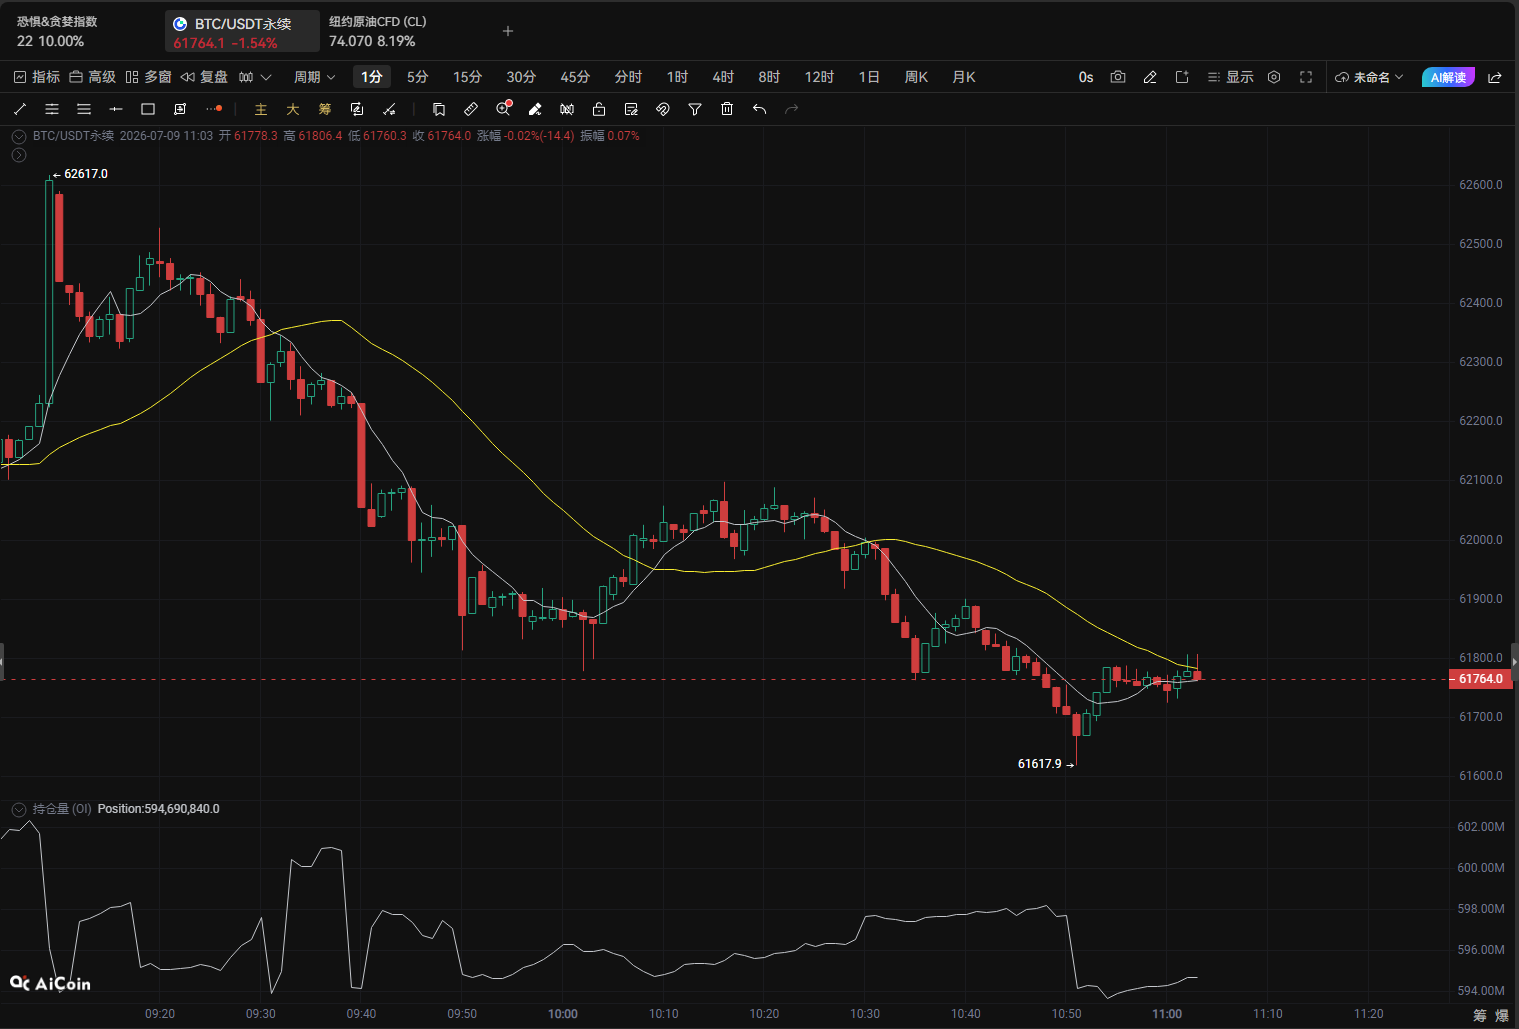
Today’s market analysis begins with two major news items. First, the Federal Reserve’s meeting minutes show increasing inflation concerns and emerging disagreements on interest rate hikes, which directly suppress liquidity expectations in the market, creating a bearish outlook for risk assets. Second, the conflict between the US and Iran has escalated, with Trump announcing an end to the temporary ceasefire agreement, further heightening geopolitical tensions, pressuring Bitcoin downward. The combination of these two messages has led market sentiment to plunge into extreme fear, with the fear and greed index dropping to 22, indicating that investor confidence is extremely fragile. In this macro context, we need to adopt a data-driven approach to analyze the market rather than being swayed by emotions. I am Qinglan, and welcome to today’s Qinglan Crypto Class.
Current Price and Time
The current time is July 9th, 11:23 AM, with Bitcoin priced at 61867 USDT. The 24-hour decline is 1.98%, with a market share of 55.84%, overall in a weak consolidating pattern. The price has pulled back from recent highs as the market digests multiple bearish news, and short-term volatility is increasing.
Multi-Cycle Status Overview
From the daily chart, the price is below the MA5, which is 63042, MA10 is 62114, and MA30 is 62609, with short-term moving averages forming a bearish arrangement. In the MACD indicator, DIF is -734.64, DEA is -1239.54, and the histogram value is 504.90. Although the histogram is above the zero axis, both DIF and DEA remain in the negative zone, indicating limited rebound momentum at the daily level. RSI is 59.66, in a neutral and weak range, not entering the oversold zone, suggesting that the downside space may not be fully released.
The 4-hour cycle shows more fatigue. The price is below all moving averages, with MA5 at 62087, MA10 at 62720, and MA30 at 62970, the moving average system is diverging downward. The MACD’s DIF is -65.33, DEA is 176.82, and the histogram value is -242.15, with bearish momentum continuing to increase. RSI is 33.26, close to the oversold area, but no effective rebound signal has been formed, indicating a clear bearish dominance.
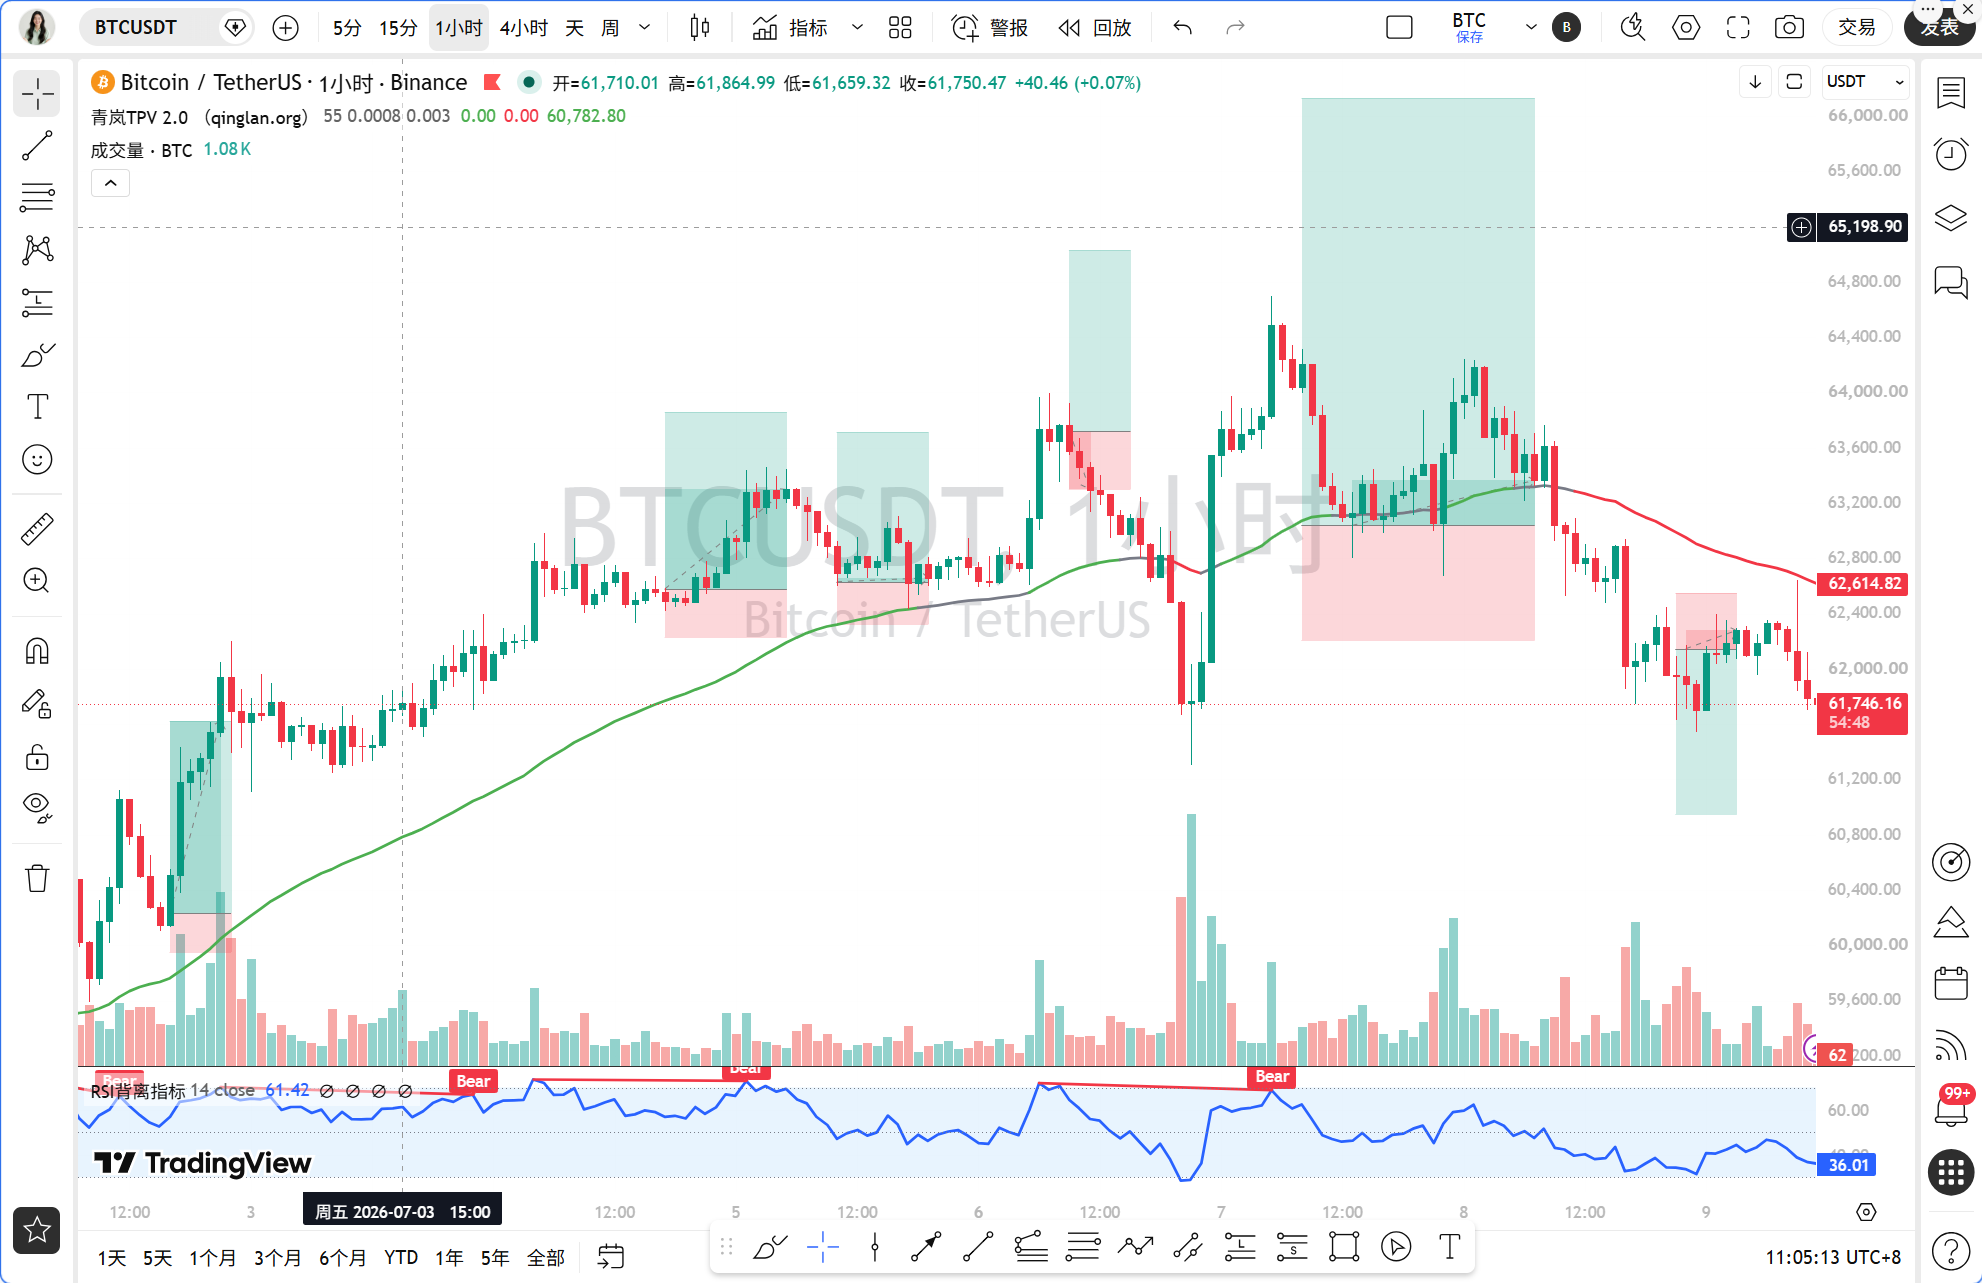
The 1-hour cycle is the core of today’s analysis. The price is reported at 61867, far below the EMA55 of 62630, with a deviation rate of 1.22%. MA5 is 61998, MA10 is 62107, and MA30 is 62388, all short-term moving averages are under pressure. The MACD’s DIF is -237.51, DEA is -253.51, and the histogram value is 16.01. Although the histogram is above the zero axis, both DIF and DEA remain negative, showing weak rebound strength. RSI is 47.89, in a neutral area, with buying and selling forces temporarily balanced.
The 15-minute cycle indicates a short-term decrease in bearish momentum. MA5 is 61866, MA10 is 62024, and MA30 is 62150, with price repeatedly testing near MA5. The MACD’s DIF is -86.99, DEA is -40.18, and the histogram value is -46.81, with a decrease in bearish momentum. RSI is 35.80, approaching the oversold area, but a reversal has not yet been confirmed.
TPV Signal Verification
According to the Qinglan TPV system, we use the 1-hour EMA55 as the boundary between bullish and bearish. The current price of 61867 is far below the EMA55 of 62630, and in the past 8 one-hour candlesticks, the number of times the closing price was above EMA55 is 0, with 0 times crossing it. The price deviation from EMA55 is 1.22%, which does not meet the oscillation threshold, hence the system judges this as a unilateral bearish trend.
Short Selling Condition Verification: First, the price is under pressure below the 1-hour EMA55, with 2 consecutive one-hour candlesticks closing below EMA55, condition met. Second, the resistance formation indicates that, from the 4-hour chart, the price has formed a long upper shadow near 63000, retracing after touching an effective high point, conforming to the characteristics of a top formation. Third, the rebound is weak; although the 1-hour MACD histogram has shortened for 2 consecutive cycles, both DIF and DEA remain negative, and RSI has limited upward momentum from 47.89, not breaking above the 50 neutral line, indicating exhausted rebound momentum. In summary, all short-selling conditions are met, and the system signal indicates a bearish dominance.
On-Chain/Funding Conditions
On-chain data shows a fear and greed index of 22, indicating extreme fear. Historically, this extreme sentiment often corresponds to short-term bottom areas, but it requires time to digest. Bitcoin's market share is 55.84%, indicating that funds are still seeking refuge in mainstream currencies, but overall liquidity is insufficient. News bears continuously pressuring the market, including project shutdowns, whale sell-offs, and tightened regulations, while positive news such as Robinhood Wallet integration and Ondo Perps launch has not formed effective upward momentum. The funding situation is tight, and the market lacks incremental funds entering.
Key Support and Resistance Levels
The first resistance level is at the 1-hour EMA55 of 62630, which is the boundary between bullish and bearish. If the price rebounds to this area, it will face bearish pressure. The second resistance level is between the 4-hour MA5 of 62087 and MA10 of 62720, in the 62000-62700 range, which is a strong resistance zone for short-term rebounds. The first support level is at 61500, near the previous low; a break below this will open downward space towards the 60000 round number. A further support level is at 58500, which is a key support level at the daily level.
Trading Strategy
Based on the bearish signal from the TPV system, the current trading strategy focuses on short selling, but it should be noted that extreme fear could lead to a sharp rebound, hence strict stop-loss settings are necessary.
Direction: Short sell.
Entry Conditions: Wait for the price to rebound near the 1-hour EMA55, in the range of 62500-62700, and enter upon seeing a long upper shadow or top formation signal. If the price directly breaks below 61500, a light short position can be taken but must confirm a volume breakout.
Stop-Loss Level: If entering in the 62500-62700 range, set the stop-loss above 63000, i.e., breaking the 4-hour MA10 position. If entering on a short sell, set the stop-loss above 61800.
Target Levels: First target at 61500, second target at 60000, third target at 58500. If the price shows a bottom formation or volume stagnation near 61500, consider partial profit-taking.
Note that the current market sentiment is extremely fearful, and a rebound may occur at any time; therefore, do not take excessively heavy short positions, suggest controlling within 5% of total funds.
Risk Warning
Geopolitical conflicts and macro policy uncertainties are high; in extreme market conditions, stop-losses may be pierced instantly, so position size must be controlled carefully.
Follow Qinglan Crypto Class to grasp more trading opportunities! Welcome to visit the official website www.qinglan.org
📊 Qinglan TPV Trading Strategy Backtest Reference
🕒 Last backtest time 07-09 07:00:02
Total analysis: 2813 Backtest: 2191 Accuracy: 75.1% (1646/2191)
免责声明:本文章仅代表作者个人观点,不代表本平台的立场和观点。本文章仅供信息分享,不构成对任何人的任何投资建议。用户与作者之间的任何争议,与本平台无关。如网页中刊载的文章或图片涉及侵权,请提供相关的权利证明和身份证明发送邮件到support@aicoin.com,本平台相关工作人员将会进行核查。