Cryptocurrency Expert: Is the bearish momentum of 7.9 Bitcoin (BTC) exhausted, and is a bullish counterattack imminent? Latest market analysis and trading advice explained
Currently, Bitcoin is at 62100. The biggest feeling over the past few days of monitoring the market is that it is teaching a lesson to all those eager for quick gains. The rebound after the price drop has never managed to break through key resistance, the MACD on the four-hour chart is starting to turn, and the daily chart has not yet shaken off the shadow of the downtrend. Many people always think about bottom fishing at the lowest point and escaping the peak at the highest point, but in reality, most of the profits come from patiently waiting for signals rather than frequent trading. Emotional trading is most inappropriate in a volatile market; instead of being swept in and out by stop-losses, it’s better to wait for a clear breakout before taking action. The safety of the principal is always more important than temporary profits.
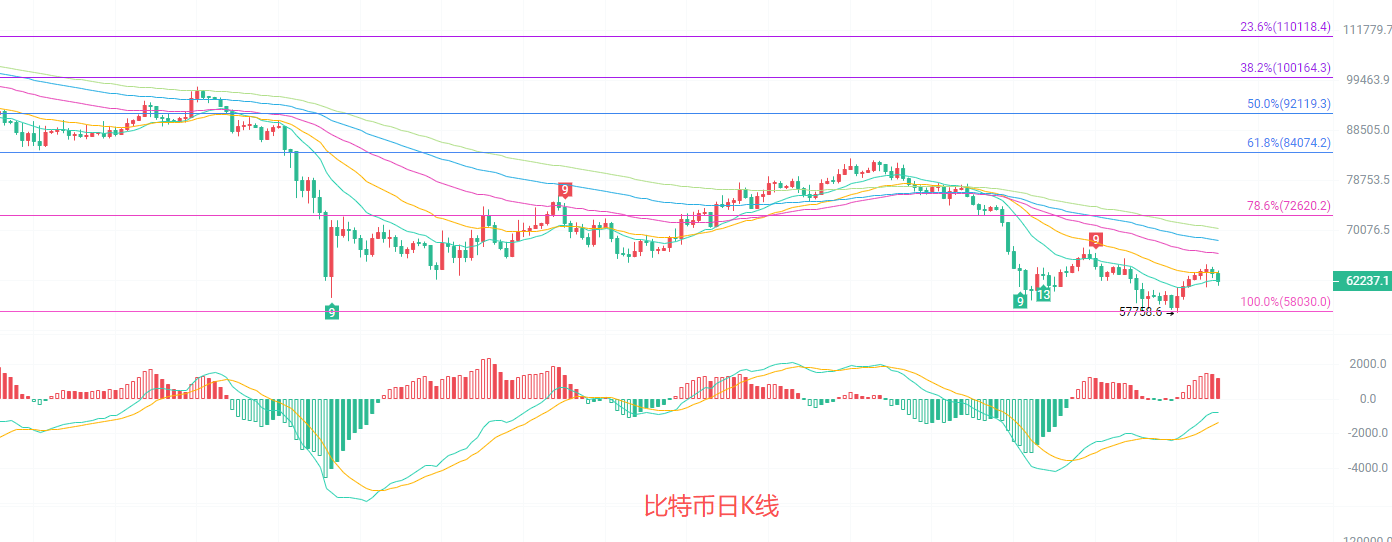
The daily candlestick is at a critical battleground. After stopping the decline above the 100% Fibonacci support level of 58030, the price is currently under pressure at the 78.6% line of 72620. In the moving average system, the EMA15, 30, and 60 are aligned downward, indicating the long-term trend remains weak, but the MACD green bars are shortening and there are signs of volume contraction. The middle line of the Bollinger Bands is around 61866, with the price just oscillating near the midline, and the short-term direction is unclear, waiting for a breakout confirmation.
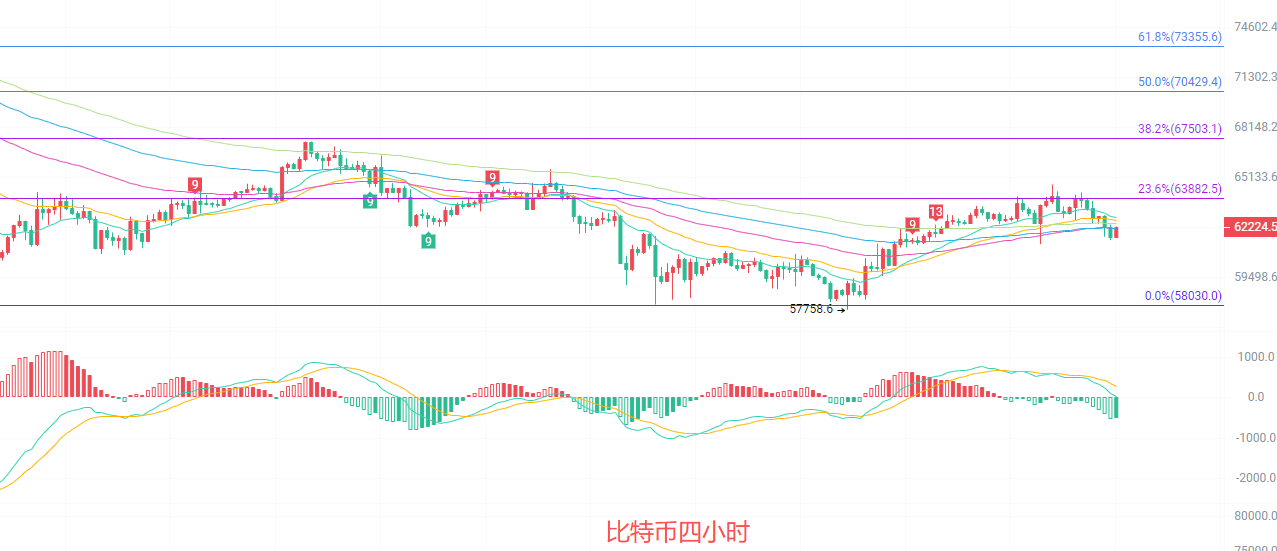
The four-hour candlestick formed a rebound channel after bottoming out at 58030, with the current price of 62100 just testing the upper edge of the channel. The EMA15 and EMA30 golden cross has flattened out, indicating a weakening upward momentum in the short term, with the MACD red bars turning green, and the DIF switching downwards. The opening of the Bollinger Bands is narrowing, with the upper boundary at 64299 and the lower boundary at 61841 forming a range of oscillation. The pressure level above is 63882, and the support level below is 61840, with a high probability of continuing a narrow consolidation in the short term, waiting for direction selection.
Short-term Reference:
If it doesn't break below 62000 to 61500, it may go upward, stop-loss at 61000, target at 63500 to 64500.
If it doesn't break above 64500 to 65000, it may go downward, stop-loss at 65500, target at 63500 to 62500.
Specific operations should be based on real-time market data. For more details, you can consult the author. The publication of the article has a delay, and the suggestions are for reference only; the risk is self-borne.

Warm Reminder: The above content is solely created by the author for the official account. The advertisements at the end of the article and in the comments section are not related to the author. Please identify with caution. Thank you for reading.
免责声明:本文章仅代表作者个人观点,不代表本平台的立场和观点。本文章仅供信息分享,不构成对任何人的任何投资建议。用户与作者之间的任何争议,与本平台无关。如网页中刊载的文章或图片涉及侵权,请提供相关的权利证明和身份证明发送邮件到support@aicoin.com,本平台相关工作人员将会进行核查。