Cryptocurrency Scholar: The 7.9 Ethereum (ETH) cycle signals a complete divergence, is the oscillating pattern hiding a crisis of trend reversal? Latest market analysis reference
The current price of Ethereum is 1808, the K-line is cold, but people's hearts are the easiest to sway. There is no need to be anxious about the current sideways oscillation, and there is no need to be entangled in immediate gains and losses; the market will not be absent, it will only be late. Trading itself is a practice; stabilize your position, calm your emotions, do not be rushed or restless, do not be greedy or panic. Act in accordance with the trend, quietly wait for a breakthrough, preserve your capital, and patiently await the bloom. Many times, letting go of the market is also letting go of the anxious self; trade diligently, and profit in the long run.
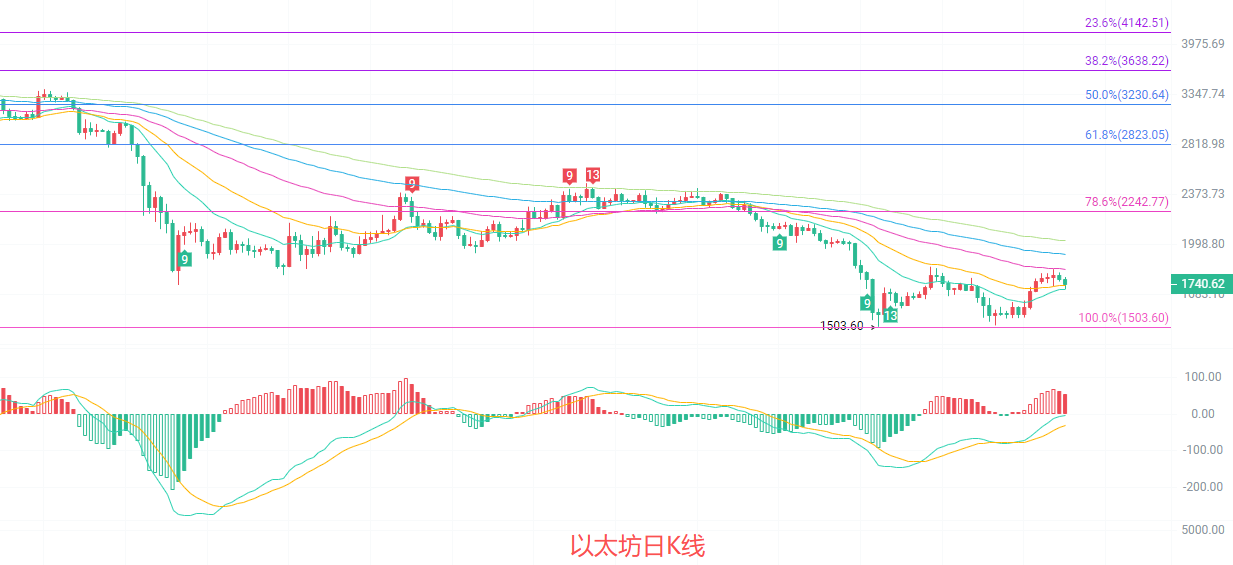
The daily K-line is at the intersection of key resistance and support. The price is currently near EMA15 and EMA30, with short-term moving averages flattening out, while EMA60 is still above, forming strong resistance; the overall moving average structure has not completely reversed. The MACD indicator shows that DIF and DEA are still near the zero axis below, with red bars shortening and rebound momentum diminishing. The middle track of the Bollinger Bands at 1678 provides support, while the upper track at 1841 constitutes short-term pressure. Overall, the daily level is still in the bottom oscillation repair stage, and there is not yet a clear trend reversal signal, with a significant divergence between the bulls and bears at this position.
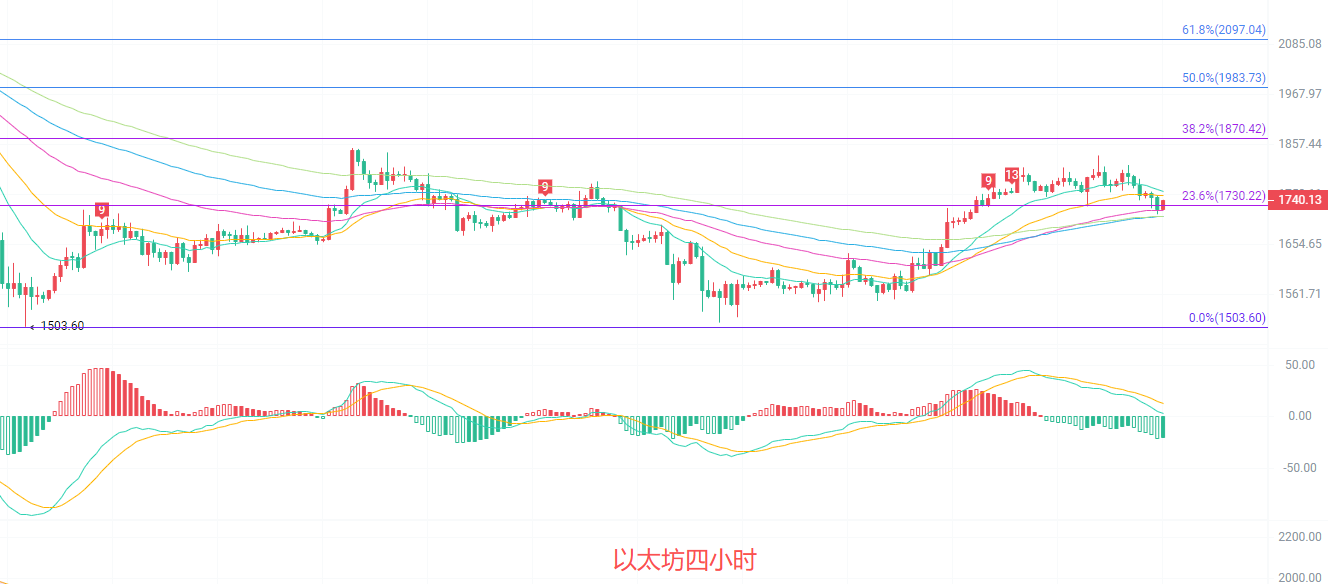
The four-hour K-line is under pressure near EMA15 and EMA30, and the short-term moving averages that were previously aligned upwards have started to flatten out, with rebound momentum significantly weakening. The MACD red bars continue to shorten, and the DIF is turning down, indicating signs of crossing below DEA to form a death cross, which shows that the short-term upward force is weakening. The Bollinger Bands are currently narrowing, and the price is operating below the middle track at 1770, close to the lower track around 1730, with the support area being tested. The Fibonacci 23.6% level near 1730 is the current key support level; if broken, it may open a new round of retracement, with resistance above in the 1780-1800 range.
Short-term reference:
If it does not break below 1730 to 1690, go long, stop loss at 1650, target looks for 1780 to 1830.
If it does not break above 1800 to 1830, go short, stop loss at 1870, target looks for 1760 to 1700.
Specific operations should be based on real-time data from the market; for more information details, you can consult the author. The article publication may be delayed; suggestions are for reference only, risks are self-borne.

Warm reminder: The above content is created by the author only on the public account. The ads at the end of the article and in the comments section are unrelated to the author; please discern carefully. Thank you for reading.
免责声明:本文章仅代表作者个人观点,不代表本平台的立场和观点。本文章仅供信息分享,不构成对任何人的任何投资建议。用户与作者之间的任何争议,与本平台无关。如网页中刊载的文章或图片涉及侵权,请提供相关的权利证明和身份证明发送邮件到support@aicoin.com,本平台相关工作人员将会进行核查。