Cryptocurrency Circle Liying: 7.9 Bitcoin (BTC) and Ethereum (ETH) Latest Market Analysis
The current price of Bitcoin is 61700, and the market situation feels like a tug of war, with both bulls and bears testing each other. For ordinary retail investors like us, this is the time when chasing highs and cutting losses is most undesirable. The current trend is in an awkward phase with resistance above and support below; although the general direction hasn't completely deteriorated, the short-term correction risk is significant. From a technical indicator standpoint, the moving average system is still in a bearish arrangement that hasn't fully reversed, and there are many obstacles to a rebound. The MACD indicator is in a weak recovery phase. The Bollinger Bands price is currently running below the middle line at 63025, showing signs of a narrowing opening, which usually indicates that a change in trend is imminent. If it cannot effectively stand above the middle line, it is highly likely to test the support strength near the lower line around 61718 again.
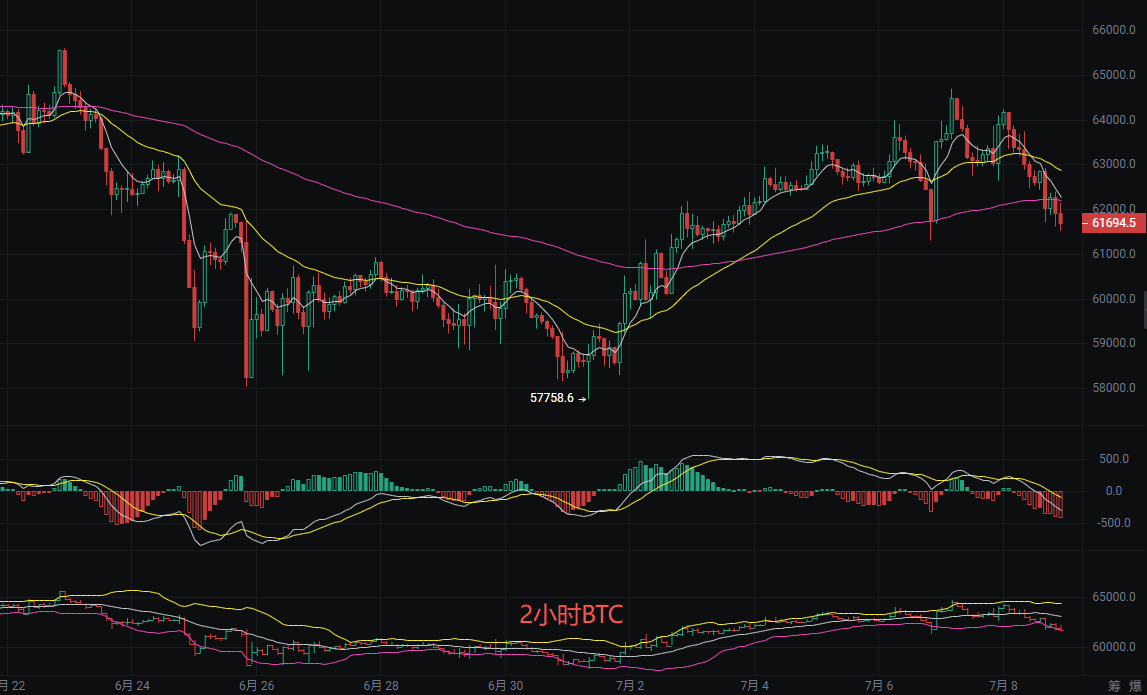
Short-term strategy reference: primarily long on short-term pullbacks, with secondary chasing on breakouts.
Long on points 61200-60700, stop loss 60200, target 62500 aiming for 63500.
Long on points 62500-63500, stop loss 64000, target 61500 aiming for 61000.
Ethereum
Family members, Ethereum was 1722 before the article was published, and the current price is stuck between a ceiling and a floor. The area above 1750-1760 is a significant resistance point for many, while the area below 1700-1720 is the last line of defense for the bulls. In such times, the market often makes big moves, either breaking upward to release resistance or plunging downward, causing panic. For us traders, this narrow range is actually the best hunting ground, with the moving average system showing a bearish arrangement, and the MACD indicator is contracting, suggesting that there is insufficient downward momentum and potential bottom divergence formation. The Bollinger Bands are narrowing, with the lower line at 1723 almost coinciding with the current price, indicating an impending trend change. If the candlestick entity effectively breaks below 1720, the Bollinger Bands will open downward, causing an accelerated decline; conversely, if it can stabilize and break above 1740, it may challenge the middle track.
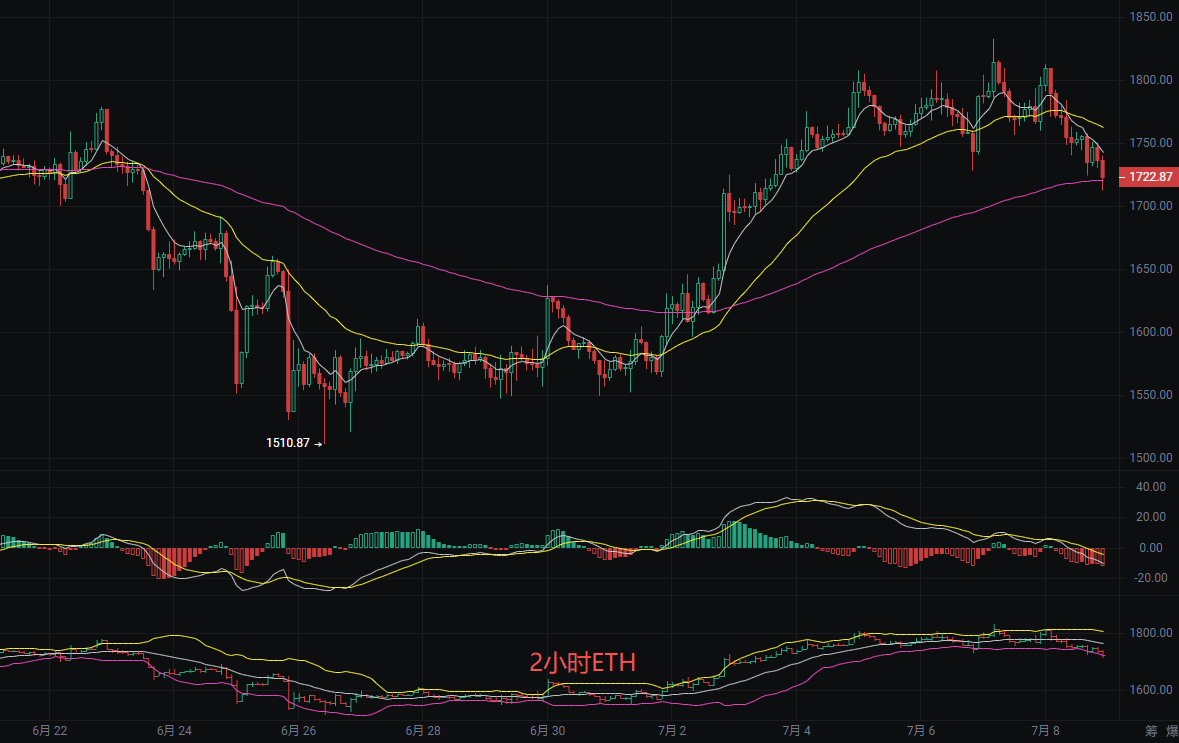
Short-term point reference:
Long on points 1750, defense at 1700, stop loss 1650, target 1800 aiming for 1850.
Long on points 1840, defense at 1860, stop loss 1900, target 1780 aiming for 1730.
The above content is exclusively original from Liying, please indicate the source when reprinting! The publication review of the article has delays, market conditions change rapidly, and the above suggestions are for reference only, with risks borne by oneself.

Warm reminder: The above content is only created by the author of the public account, and the advertisements at the end of the article and in the comments section are unrelated to the author. Please distinguish carefully, thank you for reading.
免责声明:本文章仅代表作者个人观点,不代表本平台的立场和观点。本文章仅供信息分享,不构成对任何人的任何投资建议。用户与作者之间的任何争议,与本平台无关。如网页中刊载的文章或图片涉及侵权,请提供相关的权利证明和身份证明发送邮件到support@aicoin.com,本平台相关工作人员将会进行核查。