Hello everyone, I haven't written a good in-depth article for a while. Today, I will thoroughly analyze the current market situation by combining geopolitical dynamics, macroeconomics, on-chain data, and technical indicators. The article is a bit long, so please be patient and read until the end, where I will provide specific trading suggestions! Friends who like and comment will surely become rich this year!
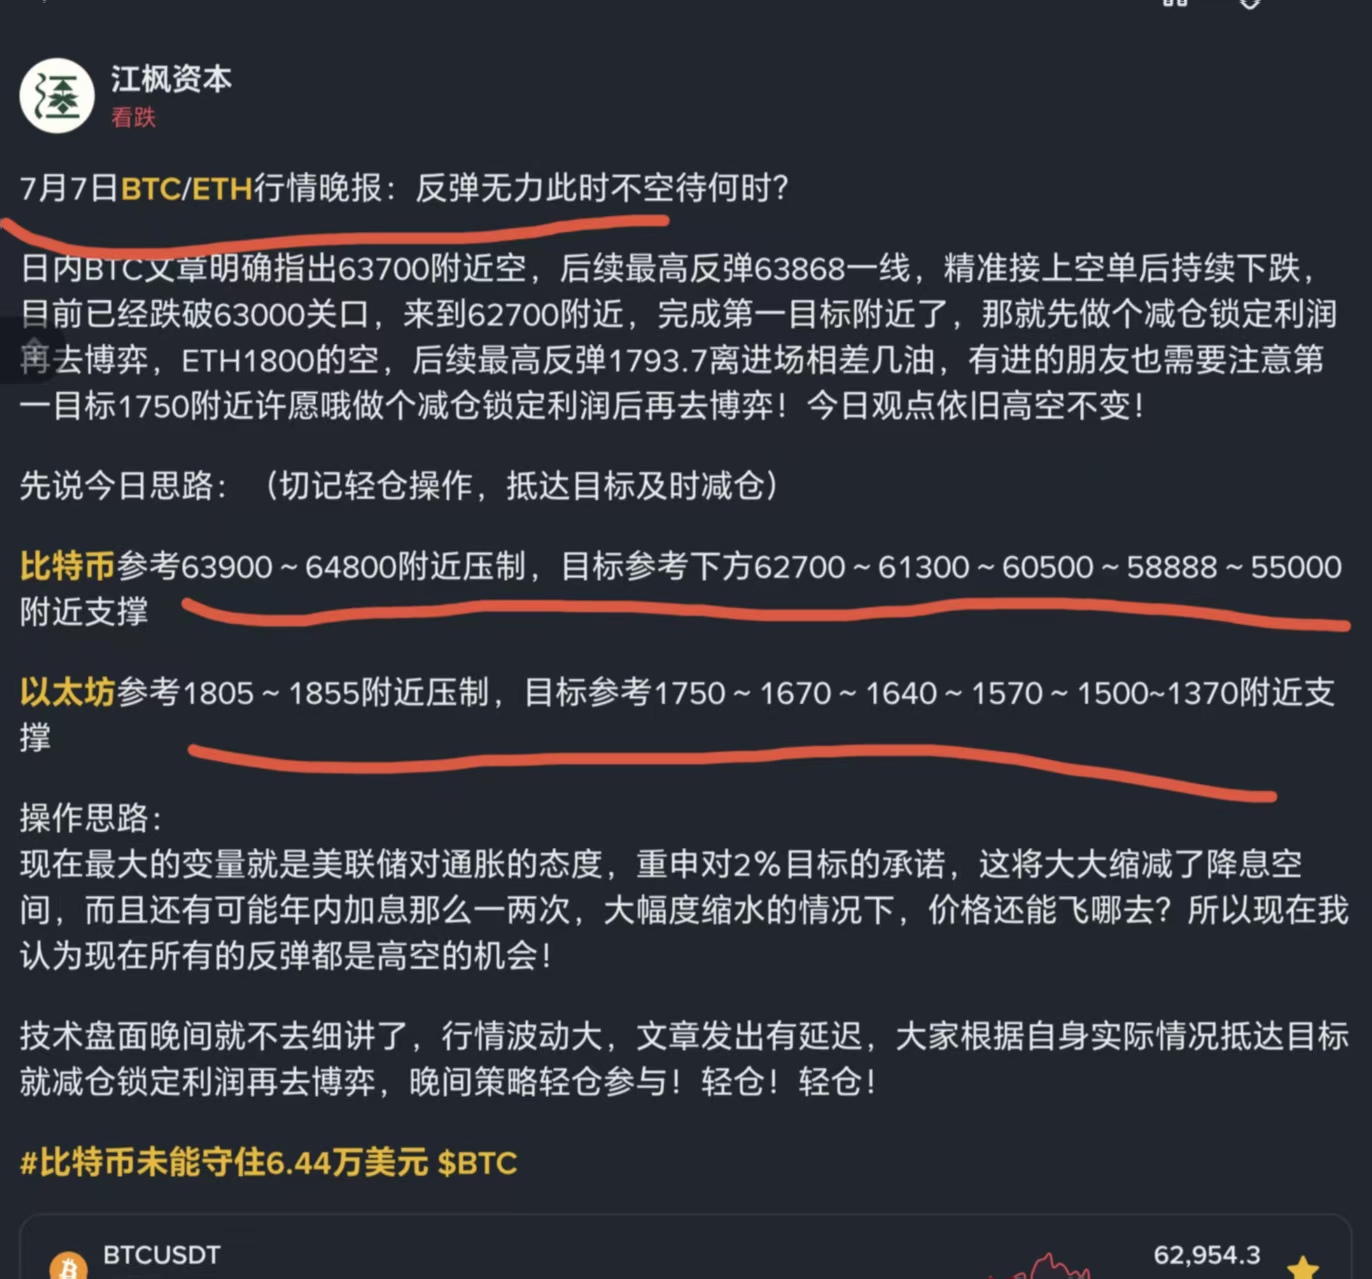
First, let me ramble for a bit. Recently, Jiang Feng's article clearly indicated high short positions for BTC at 63600, 64600, and 63900, and these have now completed targets at 62700. For ETH, high shorts around 1830, 1820, 1805, and 1800 have also essentially completed the first target of 1750. Next, let’s continue to analyze the future market trends in the current economic situation!
1. Escalating Geopolitical Situation
The U.S. has launched a new round of large-scale military strikes against multiple military targets in Iran, expanding the scale of actions compared to before, and has also revoked some temporary sanctions exemptions for Iranian oil sales. As a result, international crude oil prices experienced a surge of over 5% during the day, which will further suppress Bitcoin's price!
2. Hawkish Expectations from the Federal Reserve
The Federal Reserve released the minutes from the June FOMC meeting early on July 9, which deserves close attention as it may influence subsequent trends. In the June meeting, the Fed held the federal funds rate steady at 3.50%-3.75%, but the dot plot shows that 9 out of 19 policymakers expect at least one rate hike by the end of 2026. Waller officially took over the Fed on July 7, and the market currently prices a 65% chance of a rate hike in September.
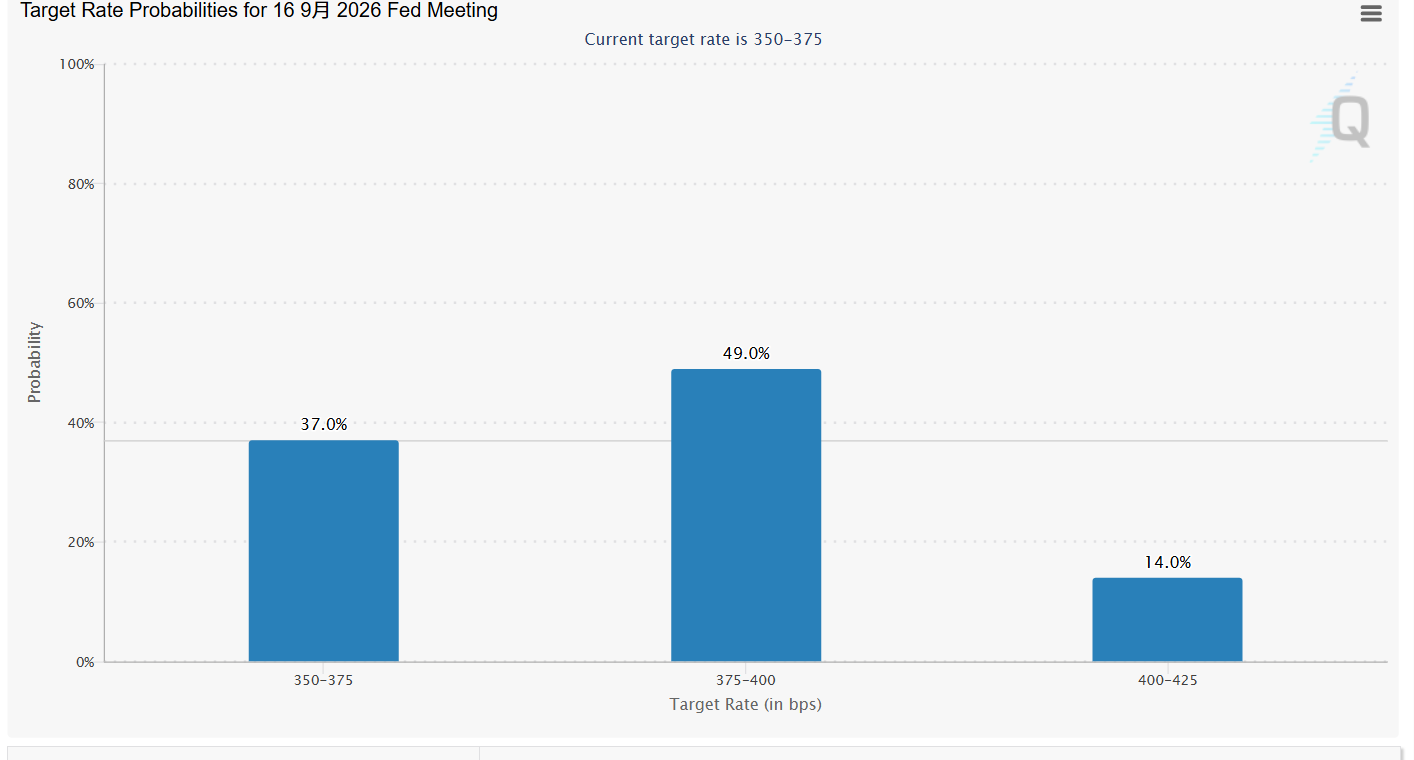
This meeting's minutes will be Waller's first important policy document after his appointment. If it signals a dovish stance, it might strengthen Bitcoin’s recent rebound; if it leans hawkish, it could accelerate the exit of funds from risk assets. However, based on Waller's previous firm commitment to a 2% target and the lack of urgency to cut rates, it seems that the statements on the 9th will still maintain a hawkish tone;
3. Positive Signals from Spot ETF Fund Inflows
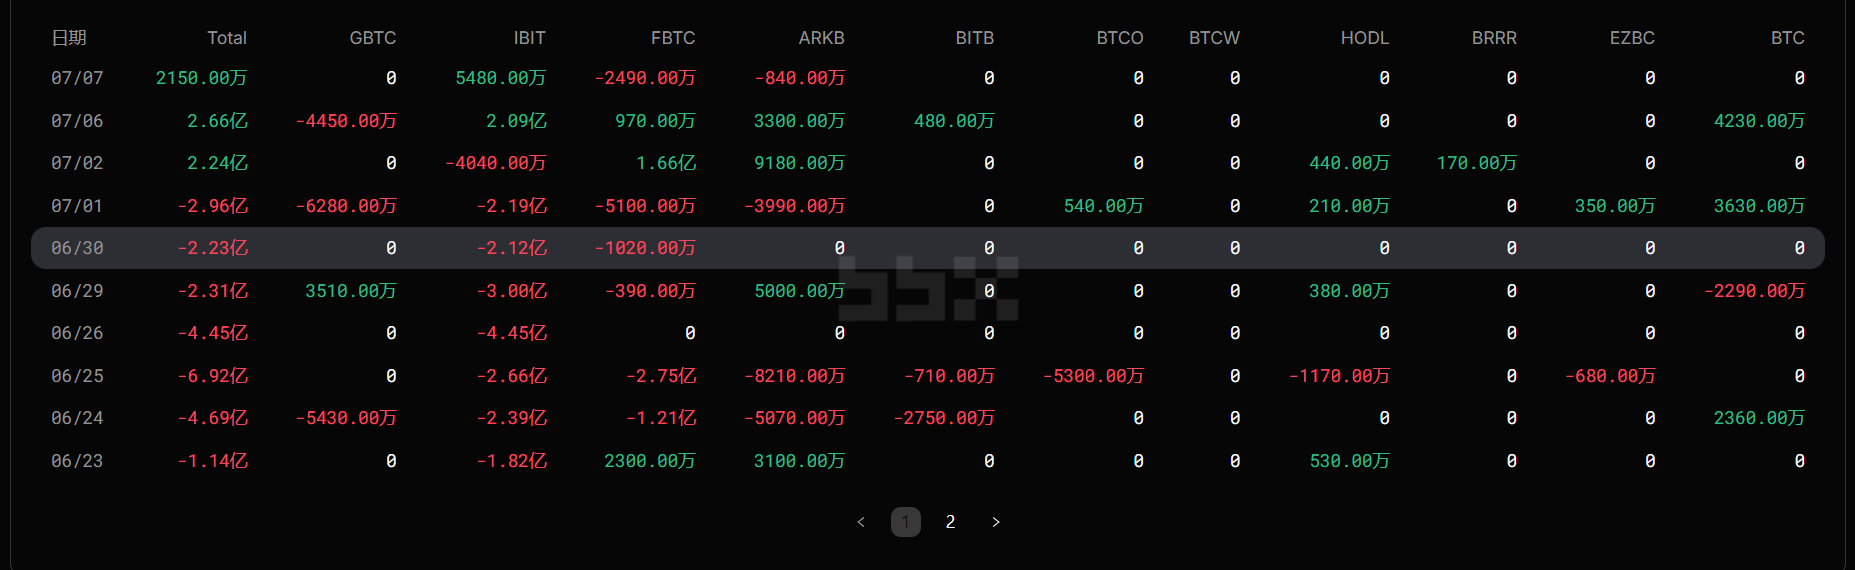
Bitcoin’s spot ETF has ended a net outflow that lasted for 10 trading days. On July 2, there was a single-day net inflow of over $222 million, and on July 6, it recorded over $266 million net inflow. Yesterday, the total net inflow of ETFs was about $21.5 million, with BlackRock's IBIT showing a net inflow of $54.8 million. However, these signals alone are not enough to determine that the market has reversed; the sustainability of ETF fund inflows remains to be observed. Citigroup has previously lowered its 12-month price target for Bitcoin from $112,000 to $82,000, citing continuous outflows from ETFs and a lack of progress in U.S. crypto legislation.
4. Technical Analysis Indicates Exhaustion of Upward Momentum
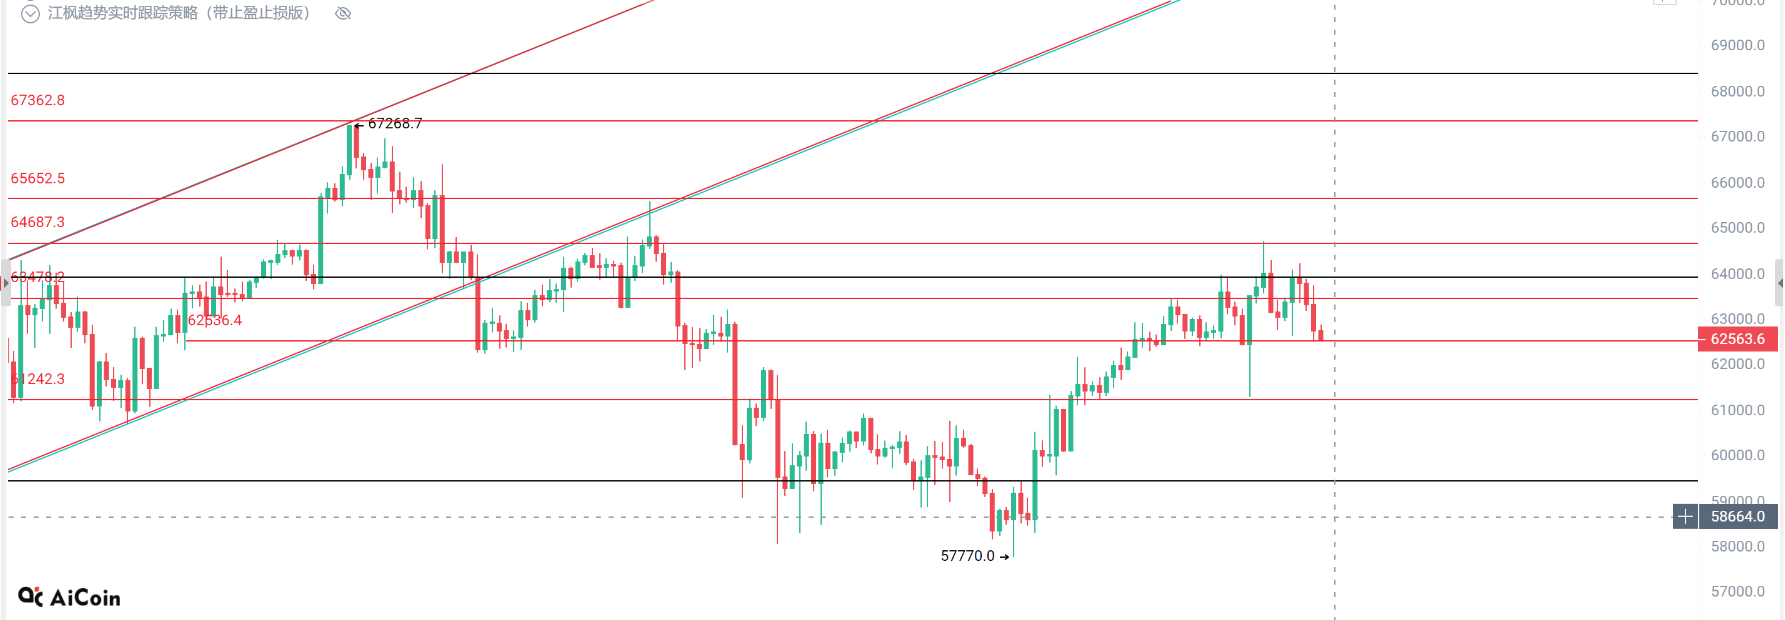
Bitcoin's recent rebound peaked at 64690 and has recorded 6 consecutive gains, but started to decline yesterday, with today’s price pulling back. The daily chart indicates entry into a short-term overbought area. After a continuous rise, profit-taking is frequently happening, further suppressing the price's upward extension. Current support is around the EMA21 moving average at 62700, with further support at the mid-band of the Bollinger Bands around 61900. The RSI indicator has turned down after being overbought, and the KDJ has formed a death cross after being overbought. The MACD on the four smaller time frames shows a red momentum bar dipping below the zero line, with the fast and slow lines forming a death cross and extending downwards, so there's no reason to go long against the trend!
In summary: I personally suggest maintaining a main strategy of shorting on the highs while being cautious with long positions!
Refer to the resistance levels above for specific entry points and target the support levels below!
Bitcoin:
Resistance levels above are around 63200~64000~64700, and support levels below to pay attention to are 62500~61800~61000~60500~58888~55000. It is recommended to reduce positions after reaching targets before placing further bets!
Ethereum:
Resistance levels above are around 1770~1800~1855, and support levels below to pay attention to are 1740~1700~1670~1570~1500~1370. It is suggested to reduce positions after reaching targets before betting again.
Note to participate lightly at the above levels! Light positions! Light positions! Pay special attention to the Federal Reserve meeting minutes on the morning of the 9th! Remember not to operate with heavy positions blindly! As long as we still have capital in hand, we have opportunities. When the time comes to buy the bottom, I hope everyone has sufficient ammunition!
Continuously updating series is not easy, and I hope it helps everyone. Please like and engage, your likes and comments are my biggest motivation to continue creating!

免责声明:本文章仅代表作者个人观点,不代表本平台的立场和观点。本文章仅供信息分享,不构成对任何人的任何投资建议。用户与作者之间的任何争议,与本平台无关。如网页中刊载的文章或图片涉及侵权,请提供相关的权利证明和身份证明发送邮件到support@aicoin.com,本平台相关工作人员将会进行核查。


