This week's report focuses on the technical structural analysis of two major targets, BTC and HYPE, over multiple timeframes. The Bitcoin section begins with daily and 4-hour cycles, outlining the adjustment structure since the peak on May 6, while also using a self-built quantitative model to predict key resistance and support levels as well as short- to medium-term trading paths for this week. The HYPE section concentrates on 4-hour level trends, analyzing the structural evolution of the current rebound and providing relevant risk management suggestions for short-term trading this week. The following are the specific contents.
Last Week's Strategy Verification
- BTC Market Prediction Verification: The previous article clearly stated that Bitcoin's short-term adjustment was nearing its end. The actual path of market operations was largely consistent with the predicted trend, validating the forward-looking analysis.
- HYPE Market Prediction Verification: The previous article pointed out that HYPE would soon present short-term buying opportunities. Currently, market trends have validated this judgment.
1. Bitcoin Multi-Period Trend Structural Analysis
1. Daily Level Trend Structural Analysis
Bitcoin Daily Candlestick Chart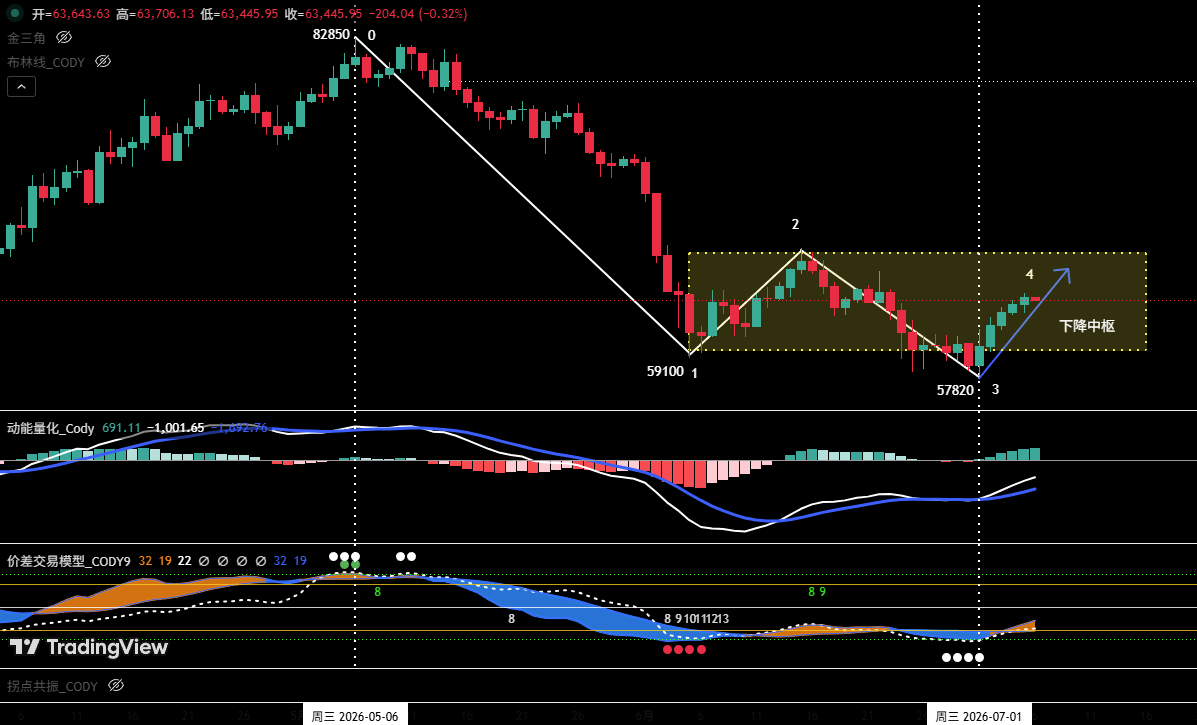
Figure 1
① As shown in Figure 1: The adjustment market that started from the May 6 high of $82,850 has displayed a clear four-part adjustment structure from "Point 0" to "Point 4" on the daily chart.
② The market is currently operating in the (3-4) rebound phase. The position of the end of "Point 4" will determine the short-term trend of the coin price.
- Path One: If the rebound price at "Point 4" can break through the resistance level of $65,700, then the probability of the coin price hitting and breaking the support at the July 1 low of $57,820 during subsequent pullbacks will significantly decrease. In this scenario, after the market adjustment ends, there is a potential for another rebound, with the overall recent trend leaning towards a range-bound pattern. The longer this oscillating structure lasts, the more it helps to decelerate the downward momentum and build strength for future bullish counterattacks.
- Path Two: If the rebound price at "Point 4" cannot reach $65,700 or even drops below $64,500, then the probability of the coin price breaking below $57,820 during subsequent pullbacks will significantly increase, with a high likelihood of the market continuing its downward trend.
③ Based on the self-built quantitative model analysis, the probability of the market entering a range-bound oscillation (i.e., Path One) is significant.
2. In-Depth Hourly Level Trend Analysis (Using 4-Hour as the Analysis Cycle)
Bitcoin 4-Hour Candlestick Chart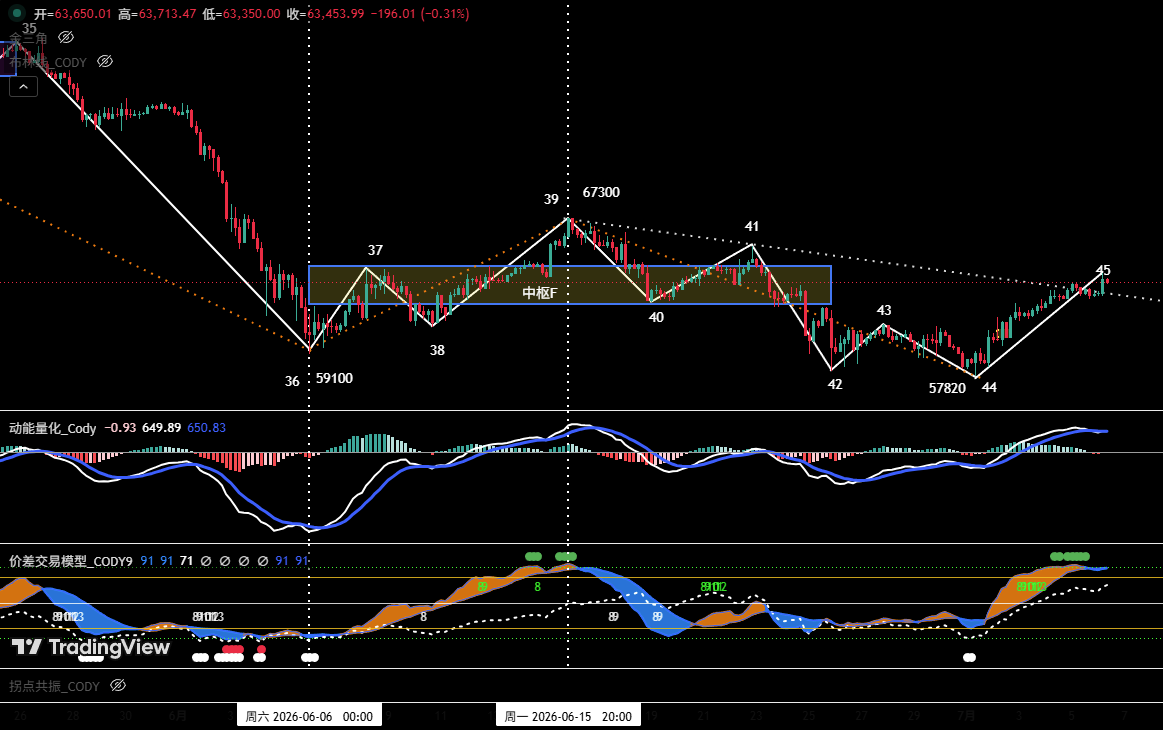
Figure 2
① In the last week's review, it was stated: "If the end of Point 44 is below $58,110 and a momentum divergence forms, the market will welcome a rebound opportunity." Last week's market trend validated this judgment, and the actual performance aligned closely with the predicted structure.
② In the 4-hour chart, the hourly downtrend that started from the June 15 peak of $67,300 has already formed a complete five-part structure; at the same time, at the end of the adjustment, a clear momentum divergence pattern has formed between "Point 44" and "Point 42," providing technical support for the subsequent oversold rebound.
③ The market is currently in the (44-45) rebound phase. From Figure 2, the current rebound peak "Point 45" has broken through the lower bound of the previous "decline center F" (approximately $62,300), and the short-term market is developing in a direction favorable for bulls. If the market can further break through "Point 41" (approximately $65,700), it suggests an upgrade in the rebound strength, and the probability of directly breaking through "Point 44" (approximately $57,820) during subsequent pullbacks will significantly decrease.
2. Bitcoin This Week's Market Prediction and Trading Strategy (07.06~07.12)
1. BTC This Week's Market Trend Prediction
Core viewpoint: Focus on the position of the daily oversold rebound peak that started from the low of $57,820.
2. Core Resistance Levels:
• First resistance area: $64,500~$65,700 (previous important high and low position)
• Second resistance area: Around $67,300 (previous important resistance area)
• Third resistance area: $69,500~$71,000 (previous important resistance area)
3. Core Support Levels:
• First support level: $60,950~$62,300 (previous important support level)
• Second support level: Around $57,820 (previous important support level)
• Third support level: Around $55,000 (previous important support level)
4. This Week's Trading Strategy
① Medium-Line Strategy:
Bitcoin Daily Candlestick Chart (Position Monitoring Model)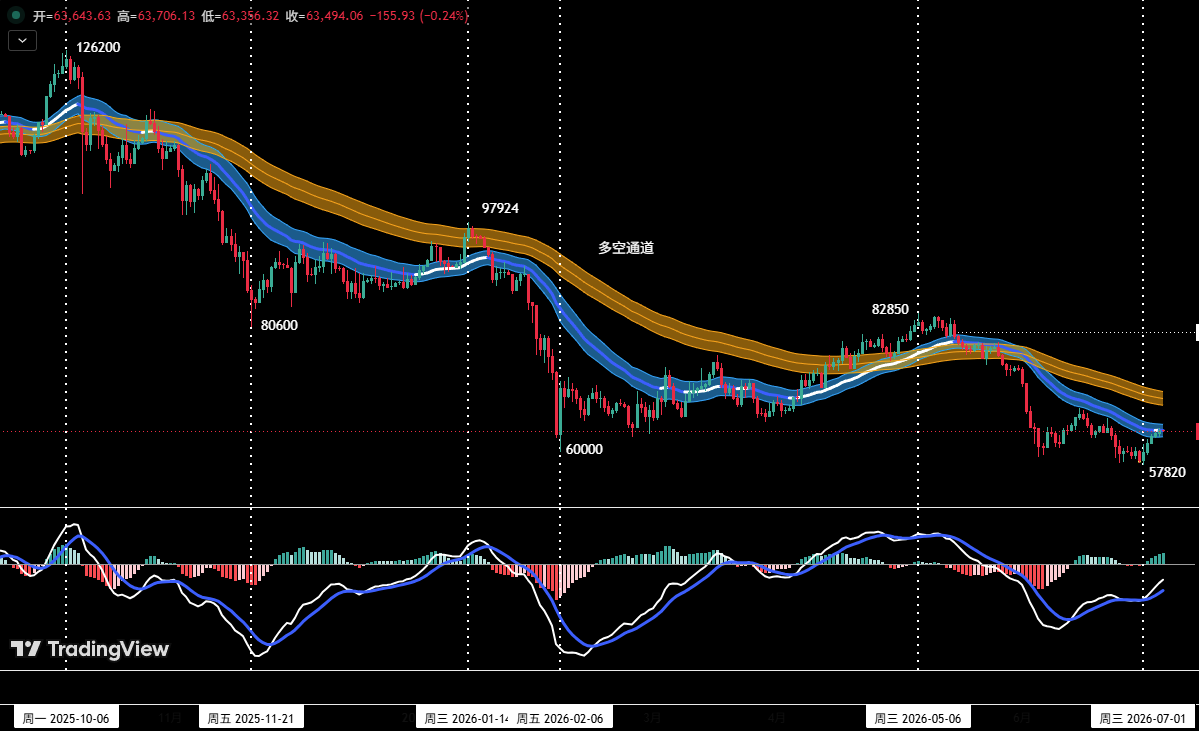
Figure 3
- The current medium-line bearish position should remain at around 20%.
- If the coin price rebounds to the $65,700~$67,300 area and shows signs of stagnation, combined with the top signals from the self-built quantitative model, it may be considered to increase the medium-line bearish position to within 50%.
② Short-Line Strategy
Utilize 30% of the position, set a stop-loss point, and seek "price difference" opportunities based on support and resistance levels (using 30 minutes/60 minutes as the operation cycle).
③ Short-Line Trading Plan
To dynamically respond to the complex market evolution, two specific trading plans, A and B, have been prepared in advance:
- Plan A: Tentative Short at Strong Resistance Zone
- Opening position: If the coin price rebounds to the $65,700~$67,300 area and meets resistance, combined with the top signals from the quantitative model, a short position of around 30% could be established.
- Risk Control: Set initial stop-loss level.
- Closing position: When adjusting near an important support level and combined with the quantitative model signals, the position could be gradually liquidated for profit.
- Plan B: Light Long at Strong Support Zone
- Opening position: If the coin price breaks through the $65,700 area and meets resistance, followed by a drop to near the strong support at $57,820 showing a stabilization signal, combined with the bottom signals from the quantitative model, a long position of about 15% could be established.
- Risk Control: Set initial stop-loss level.
- Closing position: When rebounding to near an important resistance level and combined with model signals, the position could be gradually liquidated for profit.
3. HYPE Hourly Level Trend Structural Analysis
HYPE 4-Hour Candlestick Chart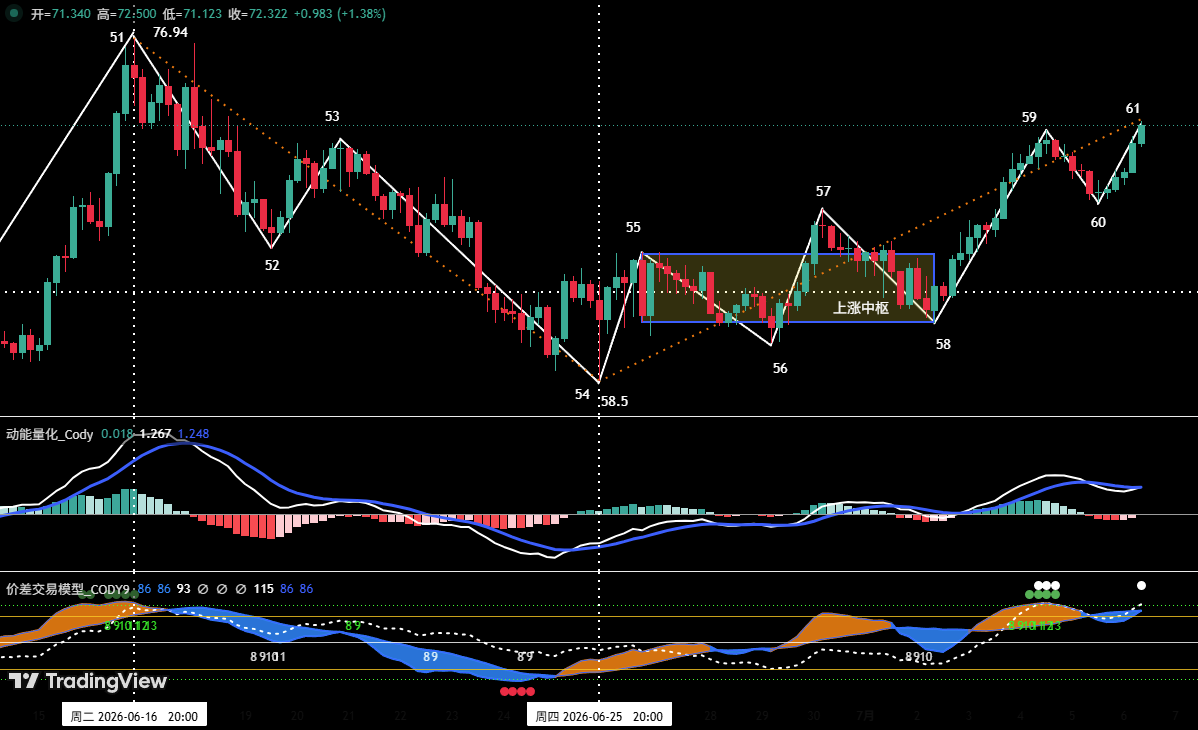
Figure 4
- As shown in Figure 4, it was previously pointed out: "If 'Point 56' is above 'Point 54', it will form a 'double bottom' pattern, which may end this round of adjustment, and the probability of rebounding from 'Point 56' is high." So far, the market's trajectory aligns closely with the predicted trend. In last week’s actual performance, HYPE's price moved from "Point 56" (approximately $60.55) to "Point 59" (approximately $72.06), with a maximum increase of around 19.01%.
- From the 4-hour chart analysis, the rebound initiated from the June 25 low of $58.5 (Point 54) can be subdivided into a seven-part upward structure: 54-55, 55-56, 56-57, 57-58, 58-59, 59-60, 60-61.
- The current price is in the 60-61 upward phase, and the overall upward structure is complete. However, according to the self-built "price difference trading model," warning signals for tops have been triggered at both "Point 59" and "Point 61," with prices approaching the historical high area near $76.94. Thus, it is not advisable to blindly chase the rise at present; caution against short-term adjustment risks is warranted.
4. HYPE This Week's Market Prediction and Short-Line Trading Strategy
1. HYPE This Week's Market Trend Prediction
Core Resistance Levels
- First resistance level: Around $75~$76.94
- Second resistance level: Around $80
Core Support Levels
- First support level: Around $68
- Second support level: Around $65.5
- Third support level: $60.5~$61.5 area
This Week's Core Viewpoint: Observe the outcome of the competition between buyers and sellers in the $75~$76.94 area as the price rises.
2. HYPE This Week's Short-Line Trading Strategy
This week focuses on locking in profits and preventing risks. If positions have been set in support zones as per the plan, it is advisable to move the stop-loss level up to around $68 to protect profits (or decide independently). If the market experiences an adjustment, positions should be closed in a timely manner to take profits.
5. HYPE Short-Line Trading Review
We strictly adhered to the trading plan and executed a short-line (long) operation last week based on the trading signals generated by the self-constructed “price difference trading model” and “momentum quantitative model,” resulting in a total trading profit of approximately 10.23%.
Short-Line Trade One: (See Table 1)
① Summary of HYPE Short-Line Trade Details: (Leverage * 1 time)
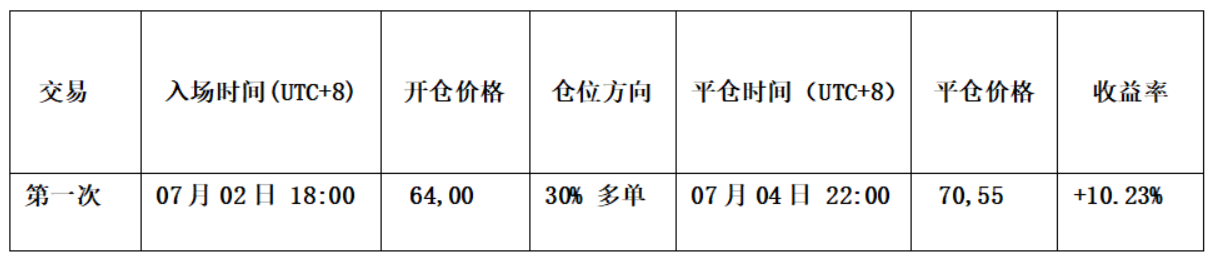
Table 1
② Short-Line Trading Review: (See Figure 5)
• Opening Strategy:
a. Based on an accurate judgment of the overall rising trend of the price.
b. When the price effectively breaks through the short-term downtrend line, and both the “price difference trading model” and “momentum quantitative model” simultaneously generate bottom divergence resonance signals.
Thus, we established a 30% long position at $64.
• Closing Strategy:
a. When the price rises to near the resistance of $72 and experiences stagnation, the K-line forms a “top divergence” pattern;
b. The “price difference trading model” triggers a strong top alert signal (green point + white point), and resonates with the “momentum quantitative model” to create a top resonance signal.
Therefore, we completed a full liquidation near $70.55.
• Summary: This trade achieved a profit of about 10.23%.
HYPE 60-Minute Candlestick Chart: (Momentum Quantitative Model + Price Difference Trading Model)
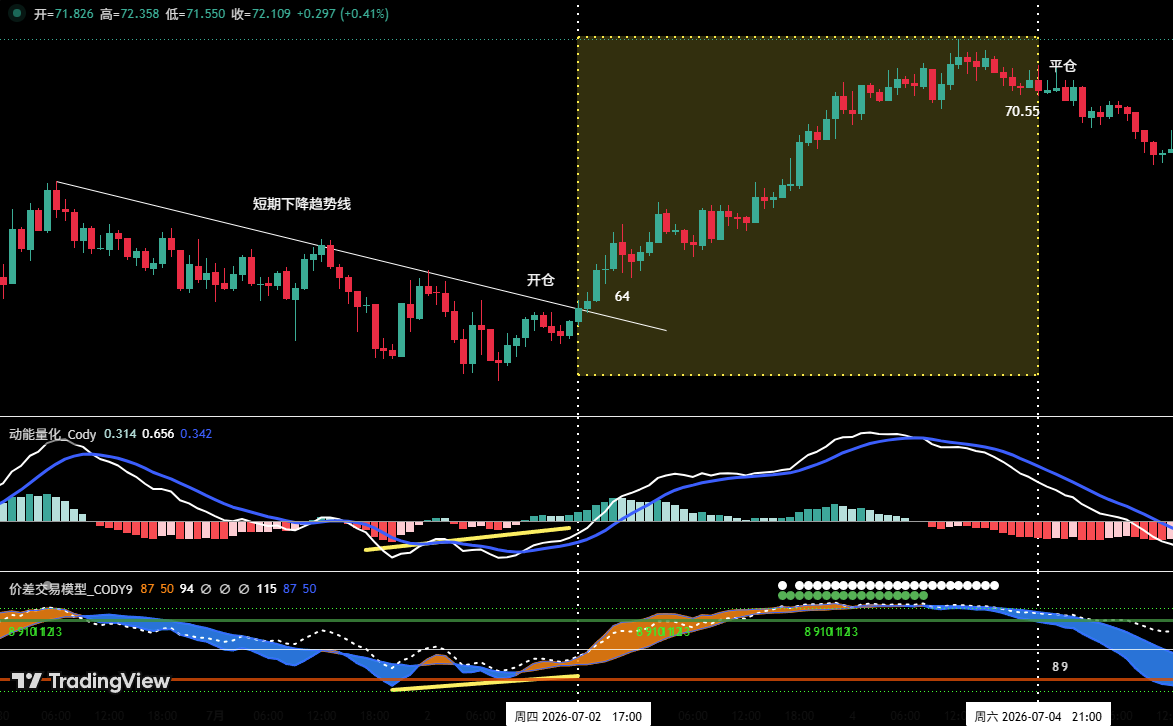
Figure 5 (Short-Line Trading Illustration)
6. Special Tips
- When opening a position: Immediately set the initial stop-loss level.
- When profit reaches 1%: Move the stop-loss level to the opening cost price (break-even point) to ensure the safety of the principal.
- When profit reaches 2%: Move the stop-loss level to the position of 1% profit.
- Ongoing tracking: After that, for every additional 1% profit, the stop-loss level will be moved 1% to dynamically protect and lock in profits.
The financial market is volatile; all market analyses and trading strategies require dynamic adjustments. All views, analytical models, and trading strategies mentioned in this article stem from personal technical analysis and are for personal trading log purposes only. They do not constitute any investment advice or operational basis. The market has risks; investment should be cautious, so please do not decide based on this.
免责声明:本文章仅代表作者个人观点,不代表本平台的立场和观点。本文章仅供信息分享,不构成对任何人的任何投资建议。用户与作者之间的任何争议,与本平台无关。如网页中刊载的文章或图片涉及侵权,请提供相关的权利证明和身份证明发送邮件到support@aicoin.com,本平台相关工作人员将会进行核查。


