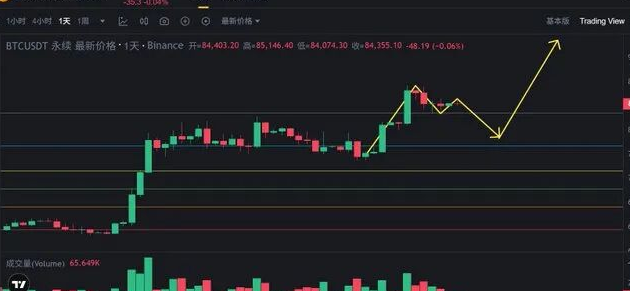
Last week's market officially closed, with both Bitcoin and Ethereum producing a bullish engulfing candlestick on the weekly chart. After a continuous week of rising prices, the market not only recovered some of the previous losses but also reignited bullish sentiment.
Although there was a pullback to the 2-hour support level during yesterday's trading, it was pulled back to higher levels near the weekly close, indicating that there are still funds supporting at lower levels. The strength of the weekly close was strong, setting a bullish tone for this week's market.
The reason this round of rebound exceeds market expectations is primarily due to the synchronization of daily, weekly, and monthly charts entering a bottom resonance, which resulted in the rise exceeding expectations both in terms of time and space.
However, with the continuous rise, the daily and lower timeframes have all entered a high-level stagnation area, and the cost-effectiveness of chasing high positions in the short term has begun to decline. This Monday, both bulls and bears are set to engage in a new round of competition at high levels, with around $64,000 becoming a significant watershed.
It is important to note that while initiating short positions at high levels starts to make some sense, the potential for BTC to catch up cannot be ignored. If mainstream funds continue to push Bitcoin’s rise, there might still be room for the market to hit new highs.
₿ Bitcoin (BTC)
Viewpoint: High-level fluctuations, waiting for directional choice.
BTC attempted to break the daily resistance level of $64,000 yesterday, and the price is still operating within a key resistance zone.
From a technical perspective, the hourly level has broken above the long-term fluctuation box at $63,800, which is an important signal for a short-term bullish trend. However, at the same time, the RSI has risen to 91.76, entering an extremely overbought area, indicating that the market is overheated in the short term and the risk of continuing to chase higher prices has significantly increased.
The core driving force behind this round of rising is not a large influx of new funds but rather:
Concentration of short leverages covering (short squeeze)
Quantitative strategies signaling to chase higher prices
Short-term speculative funds rapidly following the trend
As the rise continues, this driving force is gradually weakening. If there is no new incremental capital to take over afterwards, the probability of a high-level pullback will significantly increase.
This week, it is crucial to observe whether a bearish resonance can be formed on the daily chart; once the high level is lost, a technical correction phase cannot be ruled out.
Support levels to watch: 63,300, 62,000-62,600, 61,500
Resistance levels to watch: 63,988, 64,500, 65,000
Ethereum (ETH)
Viewpoint: High-level fluctuations, mainly focusing on short positions, consider buying on support pullbacks.
In this round of market, Ethereum has remained the leader in the rebound, overall stronger than BTC.
In terms of indicators:
RSI has risen to 55.53, once again above the 50 threshold, indicating that buying pressure still dominates, but has not yet entered an extreme overbought situation.
MACD histogram continues to expand, indicating that intermediate momentum remains positive.
However, the 4-hour level has begun to show changes.
After the price peaked around $1,808, it continued to consolidate sideways, and MACD has shown signs of a divergence, with the fast and slow lines gradually forming a death cross, indicating that bullish strength is starting to weaken.
Therefore, being cautious about the risk of a pullback at high levels is essential in the short term.
If the price stabilizes after a pullback to support, the weekly and monthly levels still have the foundation to continue advancing, and the mid-term can still focus on buying opportunities after a pullback.
Support levels to watch: 1,755, 1,720-1,730
Resistance levels to watch: 1,800-1,810, 1,830-1,845, 1,888
Tencent Meeting 24-hour live room: 759-223-4196

This article is originally published by 【HuiYing Community】 and represents personal views. Due to some transmission delays, the content is for reference only and does not constitute any investment advice. Please make rational judgments and operate cautiously.
If you need more timely daily market analysis and strategy ideas, feel free to add Safew's contact information, or add the following three: MY89080, to join the group for free learning.
Our community has 15 professional analysts monitoring the market live all day. Here you can not only learn technical analysis methods in practice but also understand the ideas for unlocking positions and risk control systems systematically.
免责声明:本文章仅代表作者个人观点,不代表本平台的立场和观点。本文章仅供信息分享,不构成对任何人的任何投资建议。用户与作者之间的任何争议,与本平台无关。如网页中刊载的文章或图片涉及侵权,请提供相关的权利证明和身份证明发送邮件到support@aicoin.com,本平台相关工作人员将会进行核查。