Cryptocurrency Expert: The 7.6 Ethereum (ETH) technical pattern has issued a warning, is the future trend already determined? Latest market analysis reference
Ethereum is currently priced at 1780. To be honest, seeing ETH oscillate around 1780 really makes me understand everyone's agony. Those who missed the chance are afraid the market will just surge and dare not wait; those who are stuck hope for a rebound to break even, becoming more anxious the longer they hold, while short sellers fear sudden price surges that will trigger stop-losses. I have repeatedly emphasized that this stage is just a rebound repair, not a bull market reversal—don't let short-term bullish candles cloud your judgment.
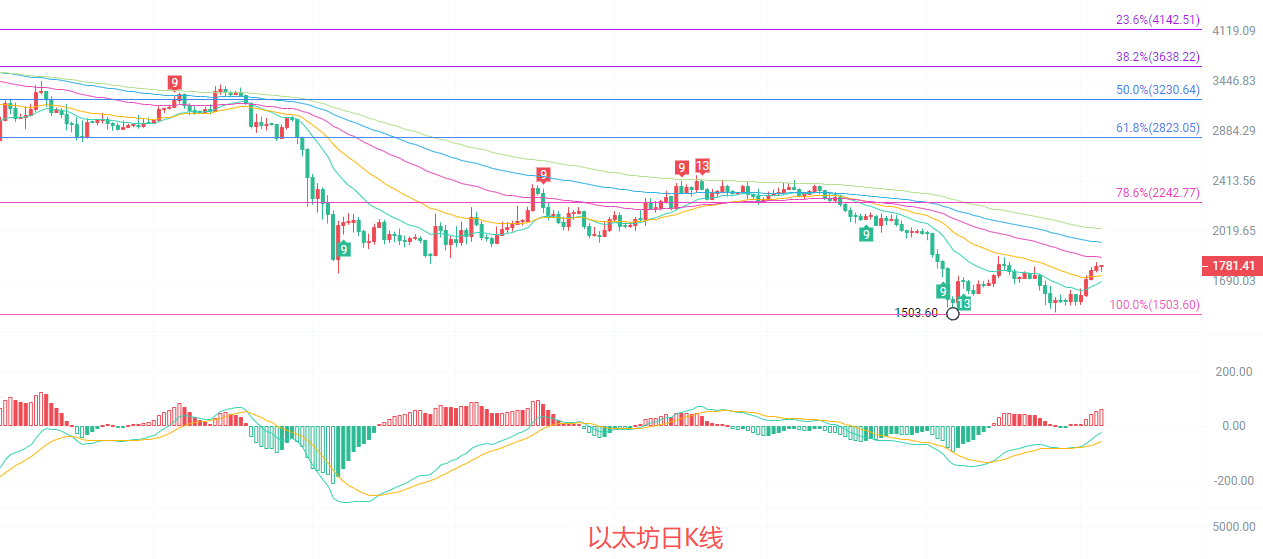
The daily K-line is just near the 23.6% Fibonacci resistance level of the previous decline wave. The EMA15/30 moving averages have formed a golden cross upwards, indicating a short-term bullish trend, but the EMA60/90 is still in a downward state, and the medium-term bearish trend has not completely reversed. The MACD indicator's bullish momentum is gradually being released. The middle band of the Bollinger Bands is around 1833, and the price is currently running below the middle band, with upper resistance at 1833 and lower support at 1518. Overall, the daily K-line is in a rebound repair stage after a decline and has not yet broken through the key resistance level. The sustainability of the rebound still needs to be verified; be alert to the risk of a high-level drop.
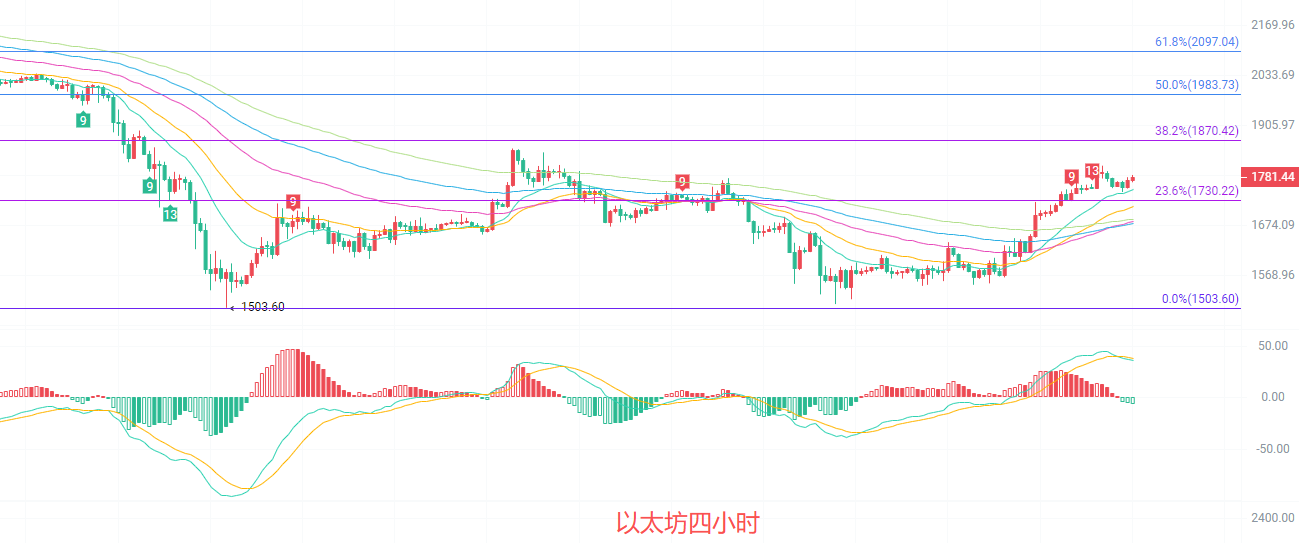
The four-hour fast line is running above the five-day moving average, showing a bullish arrangement, and the short-term upward trend is clear. The MACD's bullish momentum has weakened. The middle band of the Bollinger Bands is around 1748, and the price is running close to the upper band, with upper resistance at 1808 and lower support at 1688. The previous high point of the rebound near 1786 has formed short-term resistance; the price has tested this multiple times without effective breakthroughs, and the trading volume has not increased simultaneously, indicating insufficient momentum for an ascent. The four-hour level shows signs of stagnation at high levels, and it is highly probable that a consolidation or pullback will occur soon, requiring attention to the validity of the moving average support.
Short-term reference:
If it doesn't break below 1750 to 1700, aim upwards with a stop-loss at 1660, targeting 1820 to 1870.
If it doesn't break above 1850 to 1880, aim downwards with a stop-loss at 1910, targeting 1800 to 1750.
Specific operations depend mainly on real-time market data. For more information, please consult the author. There may be a delay in article release; this is for reference only and risks are borne by the reader.

Friendly reminder: The above content is created by the author of the official account. Advertisements at the end of the article and in the comments section are not related to the author; please discern carefully. Thank you for reading.
免责声明:本文章仅代表作者个人观点,不代表本平台的立场和观点。本文章仅供信息分享,不构成对任何人的任何投资建议。用户与作者之间的任何争议,与本平台无关。如网页中刊载的文章或图片涉及侵权,请提供相关的权利证明和身份证明发送邮件到support@aicoin.com,本平台相关工作人员将会进行核查。