Good morning, friends. I am Sister Qinglan. The market sentiment is complex today, but there are two news items worth highlighting. First, the U.S. M2 money supply has exceeded $23 trillion, reaching a new high, and expectations for liquidity expansion are heating up again, which is a long-term positive for risk assets including Bitcoin. Second, the U.S. spot Bitcoin ETF has seen net outflows for eight consecutive weeks, setting a historical record, with institutional funds continuing to flee, putting short-term pressure on prices. These two messages, one positive and one negative, precisely explain why the current market fluctuates around 62,000. We at Qinglan Crypto Classroom have always emphasized that macro liquidity is the foundation of a bull market, but the short-term flow of funds determines the rhythm. Today we will use data to analyze what kind of market BTC is brewing.
Current Price and Time
The current time is July 5th, 10:53 AM, with BTC quoted at 62,618 USDT. The 24-hour increase is only 0.27%, and the market is in a narrow oscillation state. The Fear and Greed Index has dropped to 23, belonging to the extreme fear zone, which often indicates that retail sentiment is pessimistic, but it is also a region where institutional funds may collect.
Overview of Multi-Cycle Status
Let's first look at the daily chart. Daily MA5 = 61,985, MA10 = 60,851, MA30 = 62,490. The current price is 62,618, which has moved above MA5 and MA10, but is still below MA30. The MACD shows DIF = -1,312, DEA = -1,900, and the histogram value is +588, indicating that bearish momentum is continuously weakening, and a trend where the fast line crosses above the slow line is forming. RSI = 47.36, which is in a neutral and weak area. The daily chart overall shows signs of bottom stabilization, but has not yet confirmed a reversal.
Next, let's look at the 4-hour chart. The 4-hour MA5 = 62,896, MA10 = 62,640, MA30 = 61,005. Prices oscillate between MA5 and MA10, but are far above MA30. The MACD shows DIF = 722, DEA = 654, and the histogram value is +68, indicating mild bullish momentum. RSI = 67.58, close to the overbought area but not overheated. The 4-hour structure is slightly bullish, but the upward momentum is not strong.
At the 1-hour level. The 1-hour MA5 = 62,965, MA10 = 63,110, MA30 = 62,783. Prices are running below MA5 and MA10, but above MA30. The MACD shows DIF = 160, DEA = 223, and the histogram value is -63, indicating that bearish momentum is being released. RSI = 48.75, neutral. The 1-hour shows short-term pullback pressure.
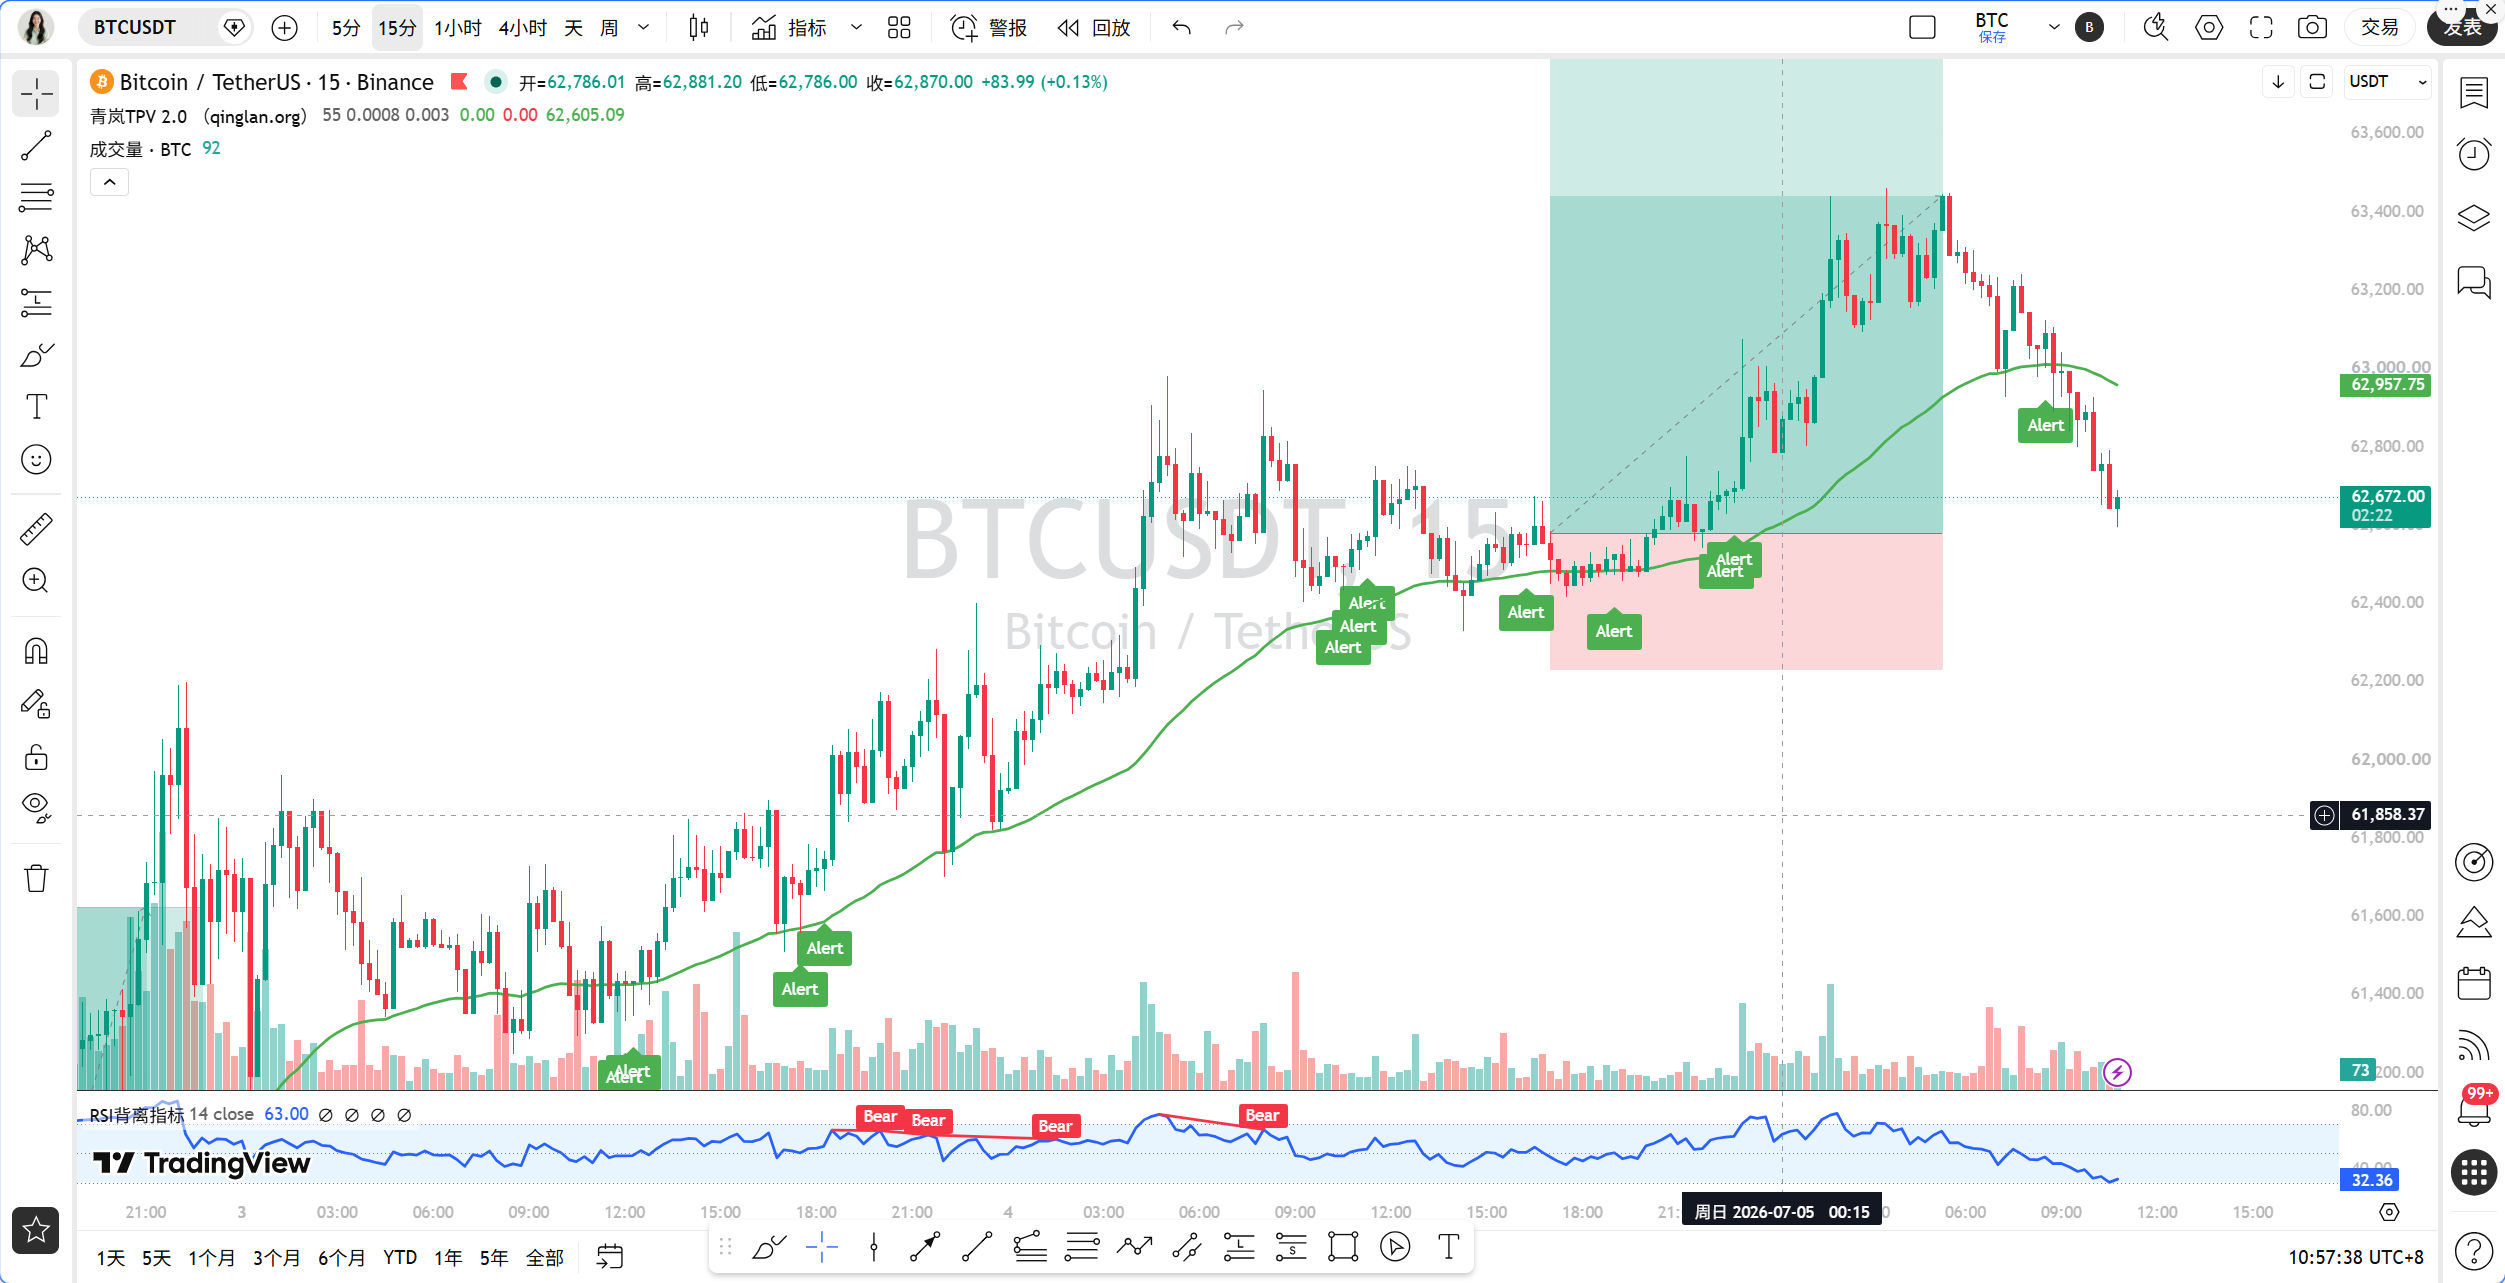
At the 15-minute level. The 15-minute MA5 = 62,728, MA10 = 62,852, MA30 = 63,101. Prices have fallen below all moving averages. The MACD shows DIF = -116, DEA = -62, and the histogram value is -53, indicating accelerating bearish momentum. RSI = 21.81, entering the oversold area. The 15-minute chart is extremely weak, indicating a need for a rebound from oversold conditions.
TPV Signal Verification
Now let's use the Qinglan TPV system for localization. The current value of the 1-hour EMA55 is 62,354, while the current price is 62,618, above EMA55. According to the rules, it is currently in a bullish trend zone. In the past 8 1-hour candles, the closing price has been greater than EMA55 8 out of 8 times, with 0 crossings, indicating that the price has consistently run above EMA55, belonging to a one-sided bullish trend, not meeting the oscillation conditions.
For bullish conditions, first, the price stands firmly above the 1-hour EMA55, with two consecutive candles closing above EMA55, which meets the condition. Second, support stabilizes, with the current price around 62,600, only 264 points away from EMA55, and the 15-minute RSI is oversold, which has the potential to form a bottom division, but it has not yet been confirmed. Third, bearish momentum is exhausted, as the 1-hour MACD histogram has shortened for two consecutive cycles, but the 15-minute MACD histogram is still expanding, indicating that short-term momentum has not yet exhausted. Overall, part of the conditions for going long are met, but we need to wait for a clear stop-loss signal at the 15-minute level.
For short-selling conditions, first, the price is pressured below the 1-hour EMA55, but the current price is above EMA55, so the condition is not met. Therefore, we do not consider shorting.
On-chain/Funding Aspects
In terms of on-chain data, the Fear and Greed Index is 23, indicating extreme fear, which historically corresponds to a phase bottom. BTC's market share is 55.72%, indicating that funds are still seeking refuge in Bitcoin, while altcoins are performing weakly. The ETF has seen net outflows for eight consecutive weeks, with a net outflow of $526 million this week, which is the biggest negative factor. However, the M2 hitting a new high and the probability of Federal Reserve interest rate hikes dropping to 21.9% creates a hedge for expectations of macro liquidity easing. There have been $239 million in liquidations in the last 24 hours, dominated by short positions, indicating that bearish power is exhausted, and once the price breaks through key resistance, it may trigger a wave of short position liquidations.
Key Offensive and Defensive Levels
The first resistance level above is at 63,000, which is the concentrated area of the 1-hour MA10 and MA30. The second resistance level is at 65,000, and breaking through this will trigger the liquidation of 651 million short positions. The first support below is at 62,354, which is the 1-hour EMA55, the lifeline for bulls. The second support is at 61,000, which is the 4-hour MA30. If it breaks below 62,354, the trend may turn bearish.
Trading Thoughts
Direction: Mainly bullish, but confirmation signals are needed.
Entry Conditions: Wait for a bottom division or long lower shadow line to appear at the 15-minute level, while the MACD histogram shortens for two consecutive cycles, and the price tests the 1-hour EMA55 without breaking. The ideal entry range is 62,350-62,500.
Stop Loss: Below 62,000, which is 200 points below the 1-hour EMA55, confirming the trend weakens.
Target Levels: First target 63,000, second target 64,000, third target 65,000.
If the price directly breaks below 62,354 and cannot recover, then abandon the bullish outlook and switch to wait-and-see.
Risk Warning
The current market is fiercely contested between bulls and bears, with continuous ETF outflows conflicting with macro liquidity expansion. Avoid heavy positions and chasing highs or lows, and strictly set stop losses.
Follow Qinglan Crypto Classroom to seize more trading opportunities! Welcome to visit our official website www.qinglan.org
Backtesting Data: The Qinglan TPV system backtested BTC 1-hour trading signals from January 2024 to June 2025, with a total of 287 trades, a win rate of 68.3%, an average profit-loss ratio of 2.1:1, and a maximum drawdown of 8.7%. Among them, the win rate for bullish signals is 71.2%, and for bearish signals, it is 64.8%. The system performs excellently in trending markets, while signal frequency decreases in oscillating markets, effectively avoiding false breakout risks.
📊 Qinglan TPV Trading Strategy Backtest Reference
🕒 Last Backtest Time 07-05 07:00:01
Total Analysis: 2724 Backtests: 2121 Accuracy Rate: 74.3% (1576/2121)
免责声明:本文章仅代表作者个人观点,不代表本平台的立场和观点。本文章仅供信息分享,不构成对任何人的任何投资建议。用户与作者之间的任何争议,与本平台无关。如网页中刊载的文章或图片涉及侵权,请提供相关的权利证明和身份证明发送邮件到support@aicoin.com,本平台相关工作人员将会进行核查。