Cryptocurrency Expert: How does the high selling pressure at 7.5 Bitcoin (BTC) play against the bottom support? Latest Market Analysis and Operational Recommendations.
The current price of Bitcoin is 63100, with oscillations observed on the chart. Many friends must feel distressed, hoping for a significant increase with every slight rise and fearing a drop with every small decline. Emotions can easily be swayed by the K-line. At this stage, it is merely a technical recovery after a decline; the overall trend has not completely reversed, so do not lose your head over short-term rebounds. Trading is primarily about waiting 70% of the time and acting 30%, so if you don’t understand the market, it’s better to observe more and act less.
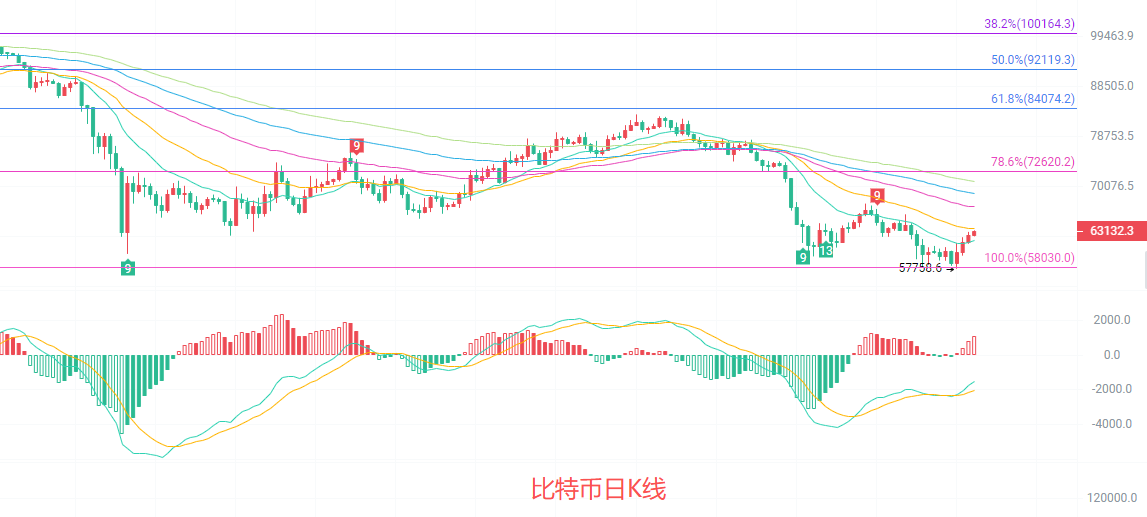
The daily K-line is currently in the rebound and recovery phase above the Fibonacci support level of 58030 from previous declines. The moving average system shows that the price remains below EMA15, 30, and 60, indicating that the long-term downward trend has not completely reversed. However, the MACD indicator has shown signs of a golden cross, with downward momentum weakening and attempts starting to push northward. The middle line of the Bollinger Bands continues to decline; although the price is above the middle line, both the upper and lower bands remain open, indicating an overall bearish trend. The short-term rebound is viewed as a technical recovery after a decline, with a strong resistance level around 72620 that needs to be closely monitored for the potential to break and establish a foothold.
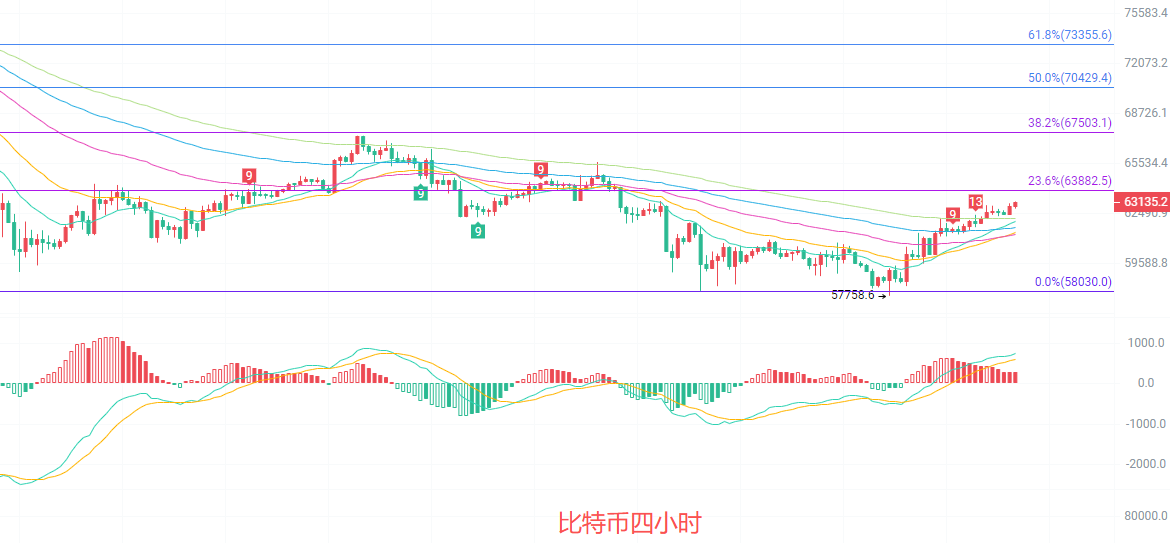
The four-hour K-line has risen above the short-term EMA15 and 30. The current price of 63106 is near the Fibonacci 23.6% resistance level of 63882. The moving average system is showing an upward trend, with EMA15 crossing above EMA30 to form a golden cross, establishing an initial short-term upward trend. The MACD indicator's DIF and DEA are operating above the zero axis, with red bars continuing to expand, and momentum remains relatively strong. The Bollinger Bands are opening upwards, and the price is operating along the upper band, showing strong short-term upward momentum. However, attention must be paid to the presence of multiple resistance levels in the 63882-66750 range; if it cannot break through with volume during the rebound, it is likely to return to oscillation or retest again, with support below to watch around 61383.
Short-term reference:
If the price does not break below 62000 to 61500, it will head north; stop-loss at 61000, target between 64000 to 65000.
If the price does not break above 64500 to 65000, it will head south; stop-loss at 65500, target between 63500 to 62500.
Specific operations should mainly rely on real-time market data. For more information, please consult the author. The publication of the article has a delay; the suggestions are for reference only, with risks to be taken personally.

Kind Reminder: The above content is solely created by the author of this public account; advertisements at the end of the article and in the comment section are unrelated to the author. Please discern carefully, and thank you for reading.
免责声明:本文章仅代表作者个人观点,不代表本平台的立场和观点。本文章仅供信息分享,不构成对任何人的任何投资建议。用户与作者之间的任何争议,与本平台无关。如网页中刊载的文章或图片涉及侵权,请提供相关的权利证明和身份证明发送邮件到support@aicoin.com,本平台相关工作人员将会进行核查。