Opening: Introduction of Important News
Dear friends, I am Sister Qinglan. Today, July 3rd, there are two important messages to pay attention to. First, in the short term, there is negative news; a large amount of BTC has been transferred to exchanges, with a wallet associated with Tim Draper depositing 1,000 BTC into Coinbase Prime, worth $61.82 million, adding short-term selling pressure to the market. At the same time, a total of 6,165 BTC have continued to flow out of Bitcoin ETFs, while Ethereum ETFs have seen a net inflow of 21,500 ETH, indicating a shift in funding preference from BTC to ETH. This divergence signal, combined with the current extreme fear in market sentiment, may indicate increased short-term volatility.
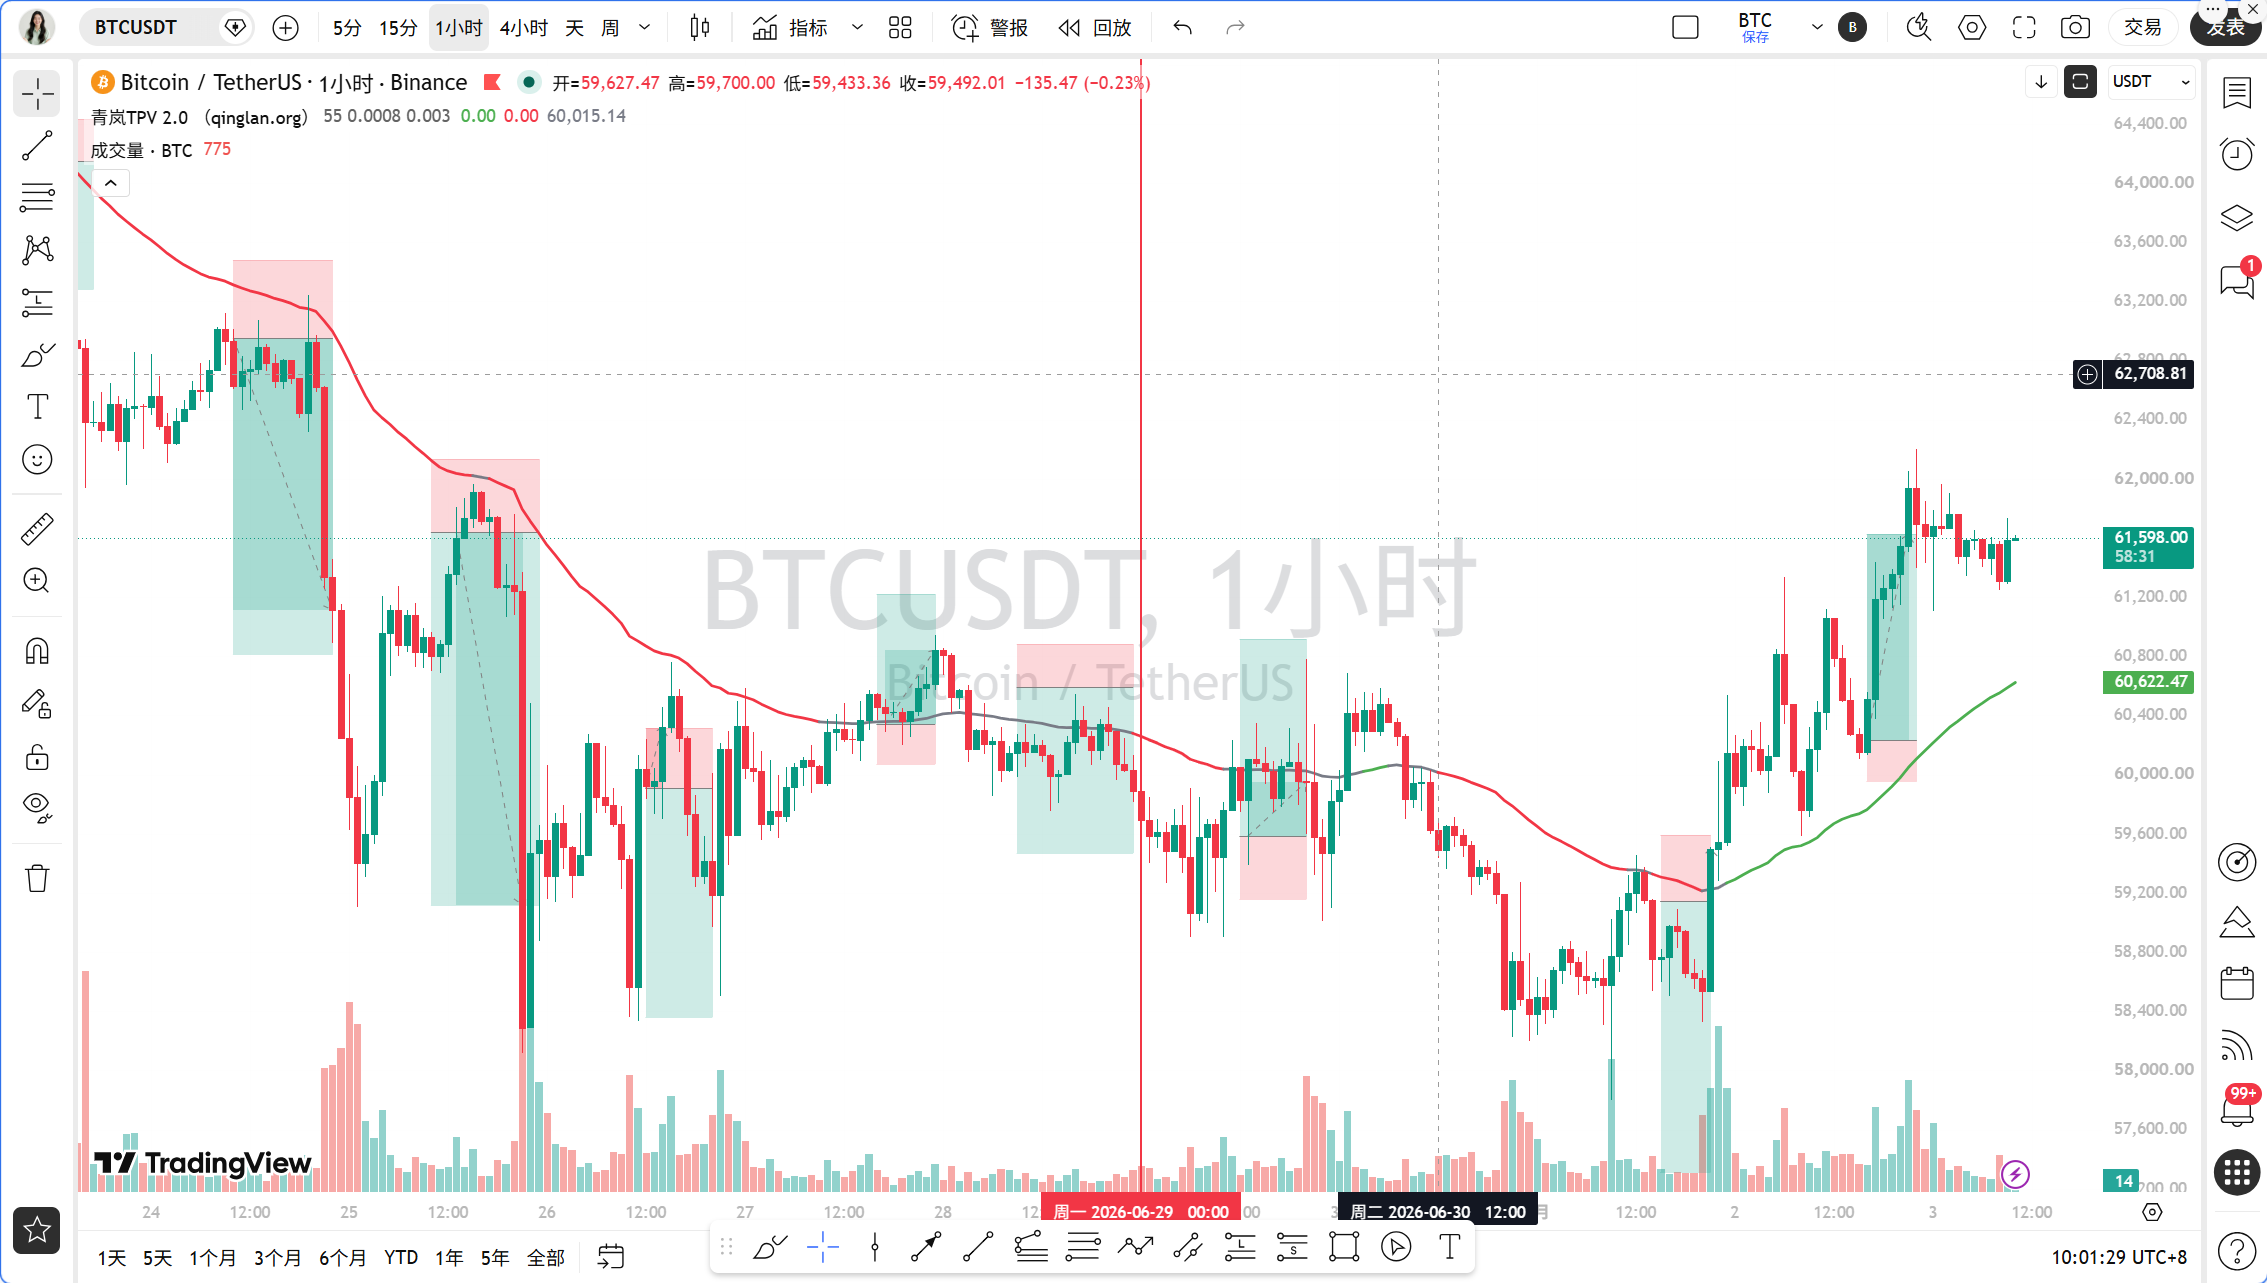
Current Price and Time
The current time is July 3rd, 10:06 AM, and the BTC price is reported at 61,544 USDT. The 24-hour increase is 2.47%, but the Fear and Greed Index is only 21, indicating extreme fear, showing that market sentiment remains pessimistic. The BTC market share is 55.62%, showing a slight decline in Bitcoin's dominant position in the overall crypto market.
Overview of Multi-Cycle Status
From the daily chart level, the MA5 and MA10 are 60,402 and 60,258 respectively, with the price above these two moving averages, but the MA30 at 62,428 constitutes upper resistance. The MACD histogram is 321.87, indicating weakening bearish momentum, while the DIF and DEA remain in negative territory, but signs of a golden cross are appearing. The RSI is 42.17, in a weak neutral area. Overall, the daily chart shows a pattern of oscillation and base building, but has not yet confirmed a reversal.
At the 4-hour level, the MA5, MA10, and MA30 are 61,510, 60,896, and 59,992, with the price moving above the moving averages. The MACD histogram is 281.91, with both DIF and DEA in positive values, and DIF crossed above DEA forming a golden cross, indicating increased bullish momentum. The RSI is 70.58, close to the overbought area, suggesting short-term retracement risks.
At the 1-hour level, the MA5, MA10, and MA30 are 61,493, 61,555, and 61,093 respectively, with the price fluctuating near the moving averages. The MACD histogram is -75.41, with both DIF and DEA in positive values but the gap is narrowing, indicating weakened bullish momentum. The RSI is 50.04, at a neutral level. The EMA55 is at 60,643, and the current price of 61,544 is well above this line, indicating a prevailing bullish trend in the short term.
At the 15-minute level, the MA5, MA10, and MA30 are 61,600, 61,492, and 61,513 respectively, with the price oscillating between the moving averages. The MACD histogram is 18.67, with both DIF and DEA in negative values but the gap is narrowing, showing a slight bullish momentum in the short term. The RSI is 50.61, slightly strong neutral.
TPV Signal Validation
According to the Qinglan TPV system, we use the 1-hour EMA55 as the boundary between bullish and bearish. The current price of 61,544 is far above the EMA55 of 60,643, and in the past 8 one-hour candles, the closing price was greater than EMA55 8 times, with 0 cross occurrences. The absolute difference in price from EMA55 is 1.48%, which does not meet the oscillation threshold, indicating a one-sided bullish trend area.
Long Conditions Validation: First, the price is stable above the 1-hour EMA55, with two consecutive 1-hour closing prices above EMA55, satisfying the condition. Second, in terms of support stabilization, the current price has rebounded multiple times near 61,500, forming short-term support, but no clear long lower shadow or bottom formation has appeared. Third, in terms of declining momentum exhaustion, while the 1-hour MACD histogram is negative, consecutive cycles have shortened, and RSI has rebounded from below 30 to 50, indicating an improvement in momentum. Overall, some long conditions are satisfied, but the support formation is not clear enough, requiring caution.
Short Conditions Validation: First, the price is under pressure below the 1-hour EMA55, and the current price is far above EMA55, meaning the condition is not satisfied. Second, in terms of encountering resistance, the 4-hour RSI is close to overbought, which may form short-term pressure. Third, in terms of weak rebounds, the 1-hour MACD histogram is negative, but has not consecutively shortened. Overall, the short conditions are not established.
On-chain and Funding Conditions
On-chain data shows that the Fear and Greed Index is 21, indicating extreme fear, which usually corresponds to the market bottom area. There is a net outflow of 6,165 BTC from BTC ETFs, while ETH ETFs have a net inflow of 21,500 ETH, with funds clearly shifting from BTC to ETH. The large amount of BTC moving to exchanges increases short-term selling pressure, but positive news such as Standard Chartered supporting Uniswap and the SEC shifting to support crypto provides long-term confidence for the market. U.S. stock crypto concept stocks have strengthened against the trend, with Strategy rising 7.9%, indicating that traditional funds are still interested in crypto assets.
Key Offensive and Defensive Levels
Upper resistance levels: 4-hour MA5 around 61,510, daily MA30 at 62,428, and the previous high region of 62,000. Lower support levels: 1-hour EMA55 at 60,643, 4-hour MA10 at 60,896, and the psychological level of 60,000. If the price falls below 60,643, the bullish trend may turn into oscillation or bearish.
Trading Idea
Direction: Cautious bullish, but need to wait for confirmation signals.
Entry Conditions: If the price pulls back near the 1-hour EMA55 (around the 60,643-60,800 area) and shows a long lower shadow or bottom formation, while the MACD histogram shortens consecutively, a light long position can be taken. If the price directly breaks through 62,000 and stabilizes, more can be added.
Stop Loss Level: After entering the long position, set the stop loss below 60,000 or stop loss after breaking the 1-hour EMA55.
Target Levels: First target 62,000, second target 62,428 (daily MA30), third target 63,000.
Risk Warning
Current market sentiment is extremely fearful, funds are diverging, and short-term volatility may intensify; it’s essential to control positions and enforce strict stop losses.
Follow the Qinglan Crypto Classroom to grasp more trading opportunities! Welcome to visit the official website www.qinglan.org
📊 Qinglan TPV Trading Strategy Backtest Reference
🕒 Last Backtest Time 07-03 07:00:02
Total Analysis: 2678 Backtests: 2066 Accuracy Rate: 73.6% (1521/2066)
免责声明:本文章仅代表作者个人观点,不代表本平台的立场和观点。本文章仅供信息分享,不构成对任何人的任何投资建议。用户与作者之间的任何争议,与本平台无关。如网页中刊载的文章或图片涉及侵权,请提供相关的权利证明和身份证明发送邮件到support@aicoin.com,本平台相关工作人员将会进行核查。