Dear friends, I am Sister Qinglan. Today the market news is very lively, and I will highlight the two most critical points to start. First, the pre-NFP data for June has been released, showing that new employment may drop sharply to 110,000, which is far below market expectations. If the data materializes, it will directly strengthen the Fed's interest rate cut expectations, which would be a strong benefit for risk assets like BTC. Second, the BTC ETF in the US has experienced a continued net outflow of $296 million, while the Ethereum ETF has contradictory inflows of $14.8 million, indicating that institutional funds are shifting from BTC to ETH. This may reflect the market's long-term confidence in Ethereum's upgrade. These two pieces of news present one positive and one negative, but the potential benefits from the NFP are more worthy of attention as they might change the overall macro liquidity expectations.
Current Price and Time
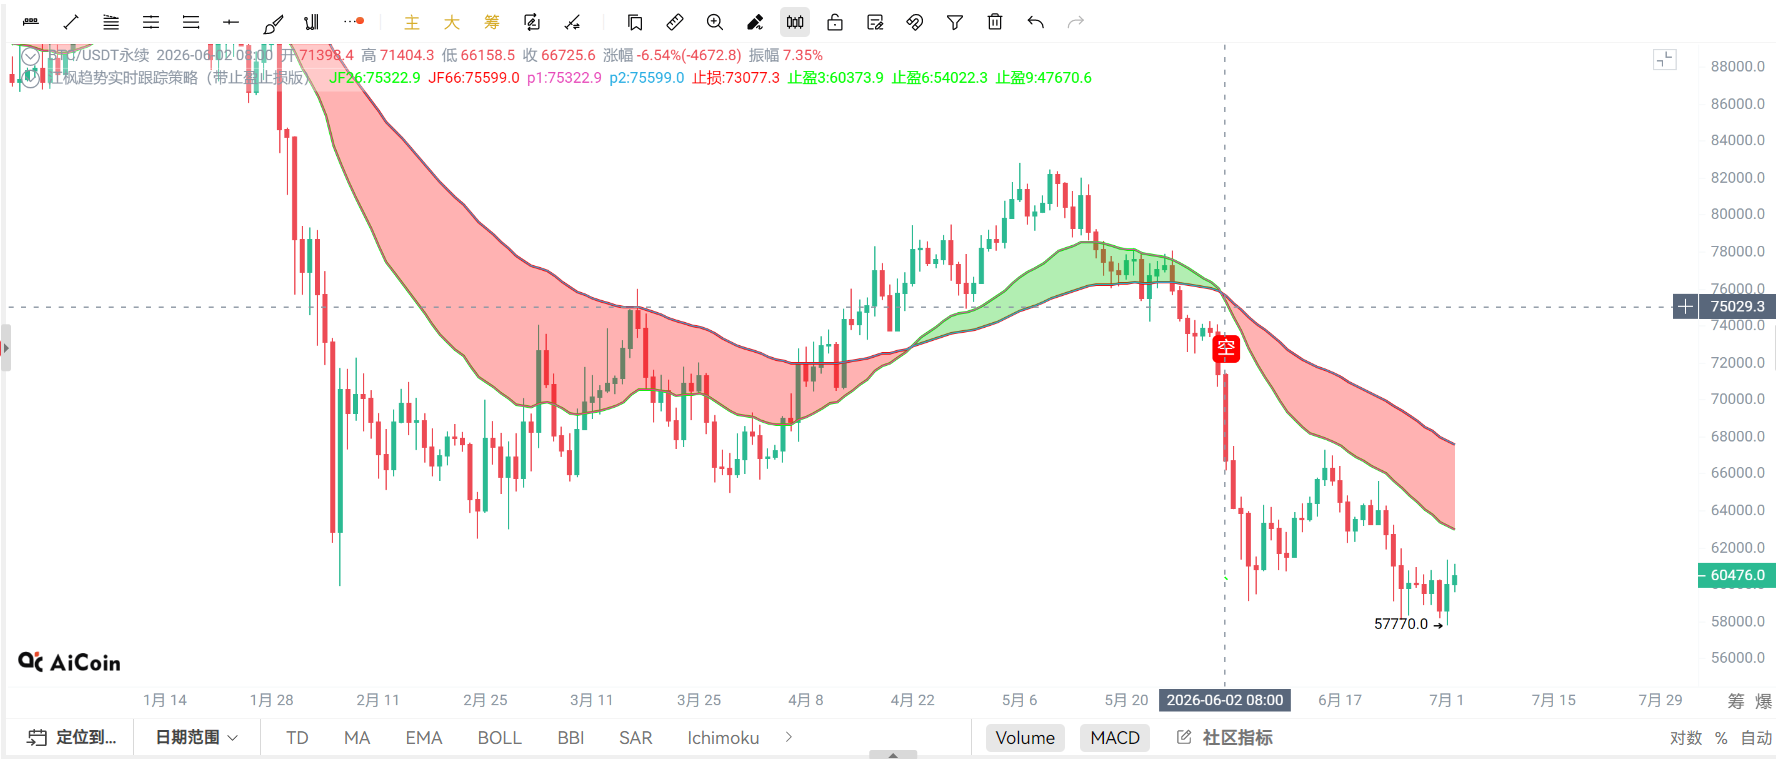
The current time is July 2, 16:49 Beijing time, with the BTC price at 60,500 USDT. The increase over the last 24 hours is 2.92%, and the price has just slightly retreated after breaking through the $61,000 level, currently in a state of consolidation. The Fear and Greed Index is only 19, indicating extreme fear in the market, yet the price is rebounding, which often means a bottoming area is forming.
Multi-Cycle Status Overview
First, looking at the daily chart, MA5 is at 59,797, MA10 is at 60,271, and MA30 is at 62,480. The price is above both MA5 and MA10 but still below MA30. The MACD histogram is positive at 139.66; although DIF and DEA are negative, the difference is narrowing. The RSI is at 39.99, in a neutral but weak area. The daily level shows a rebound after a decline, with the trend not yet reversed.
On the 4-hour chart, MA5 is at 60,352, MA10 is at 59,712, and MA30 is at 59,798. The price is stable above all moving averages. The MACD histogram is positive at 217.99; DIF has just crossed above the zero line, and the RSI is at 56.27, indicating that bullish momentum is strengthening. The 4-hour chart presents a clear structure of higher bottoms.
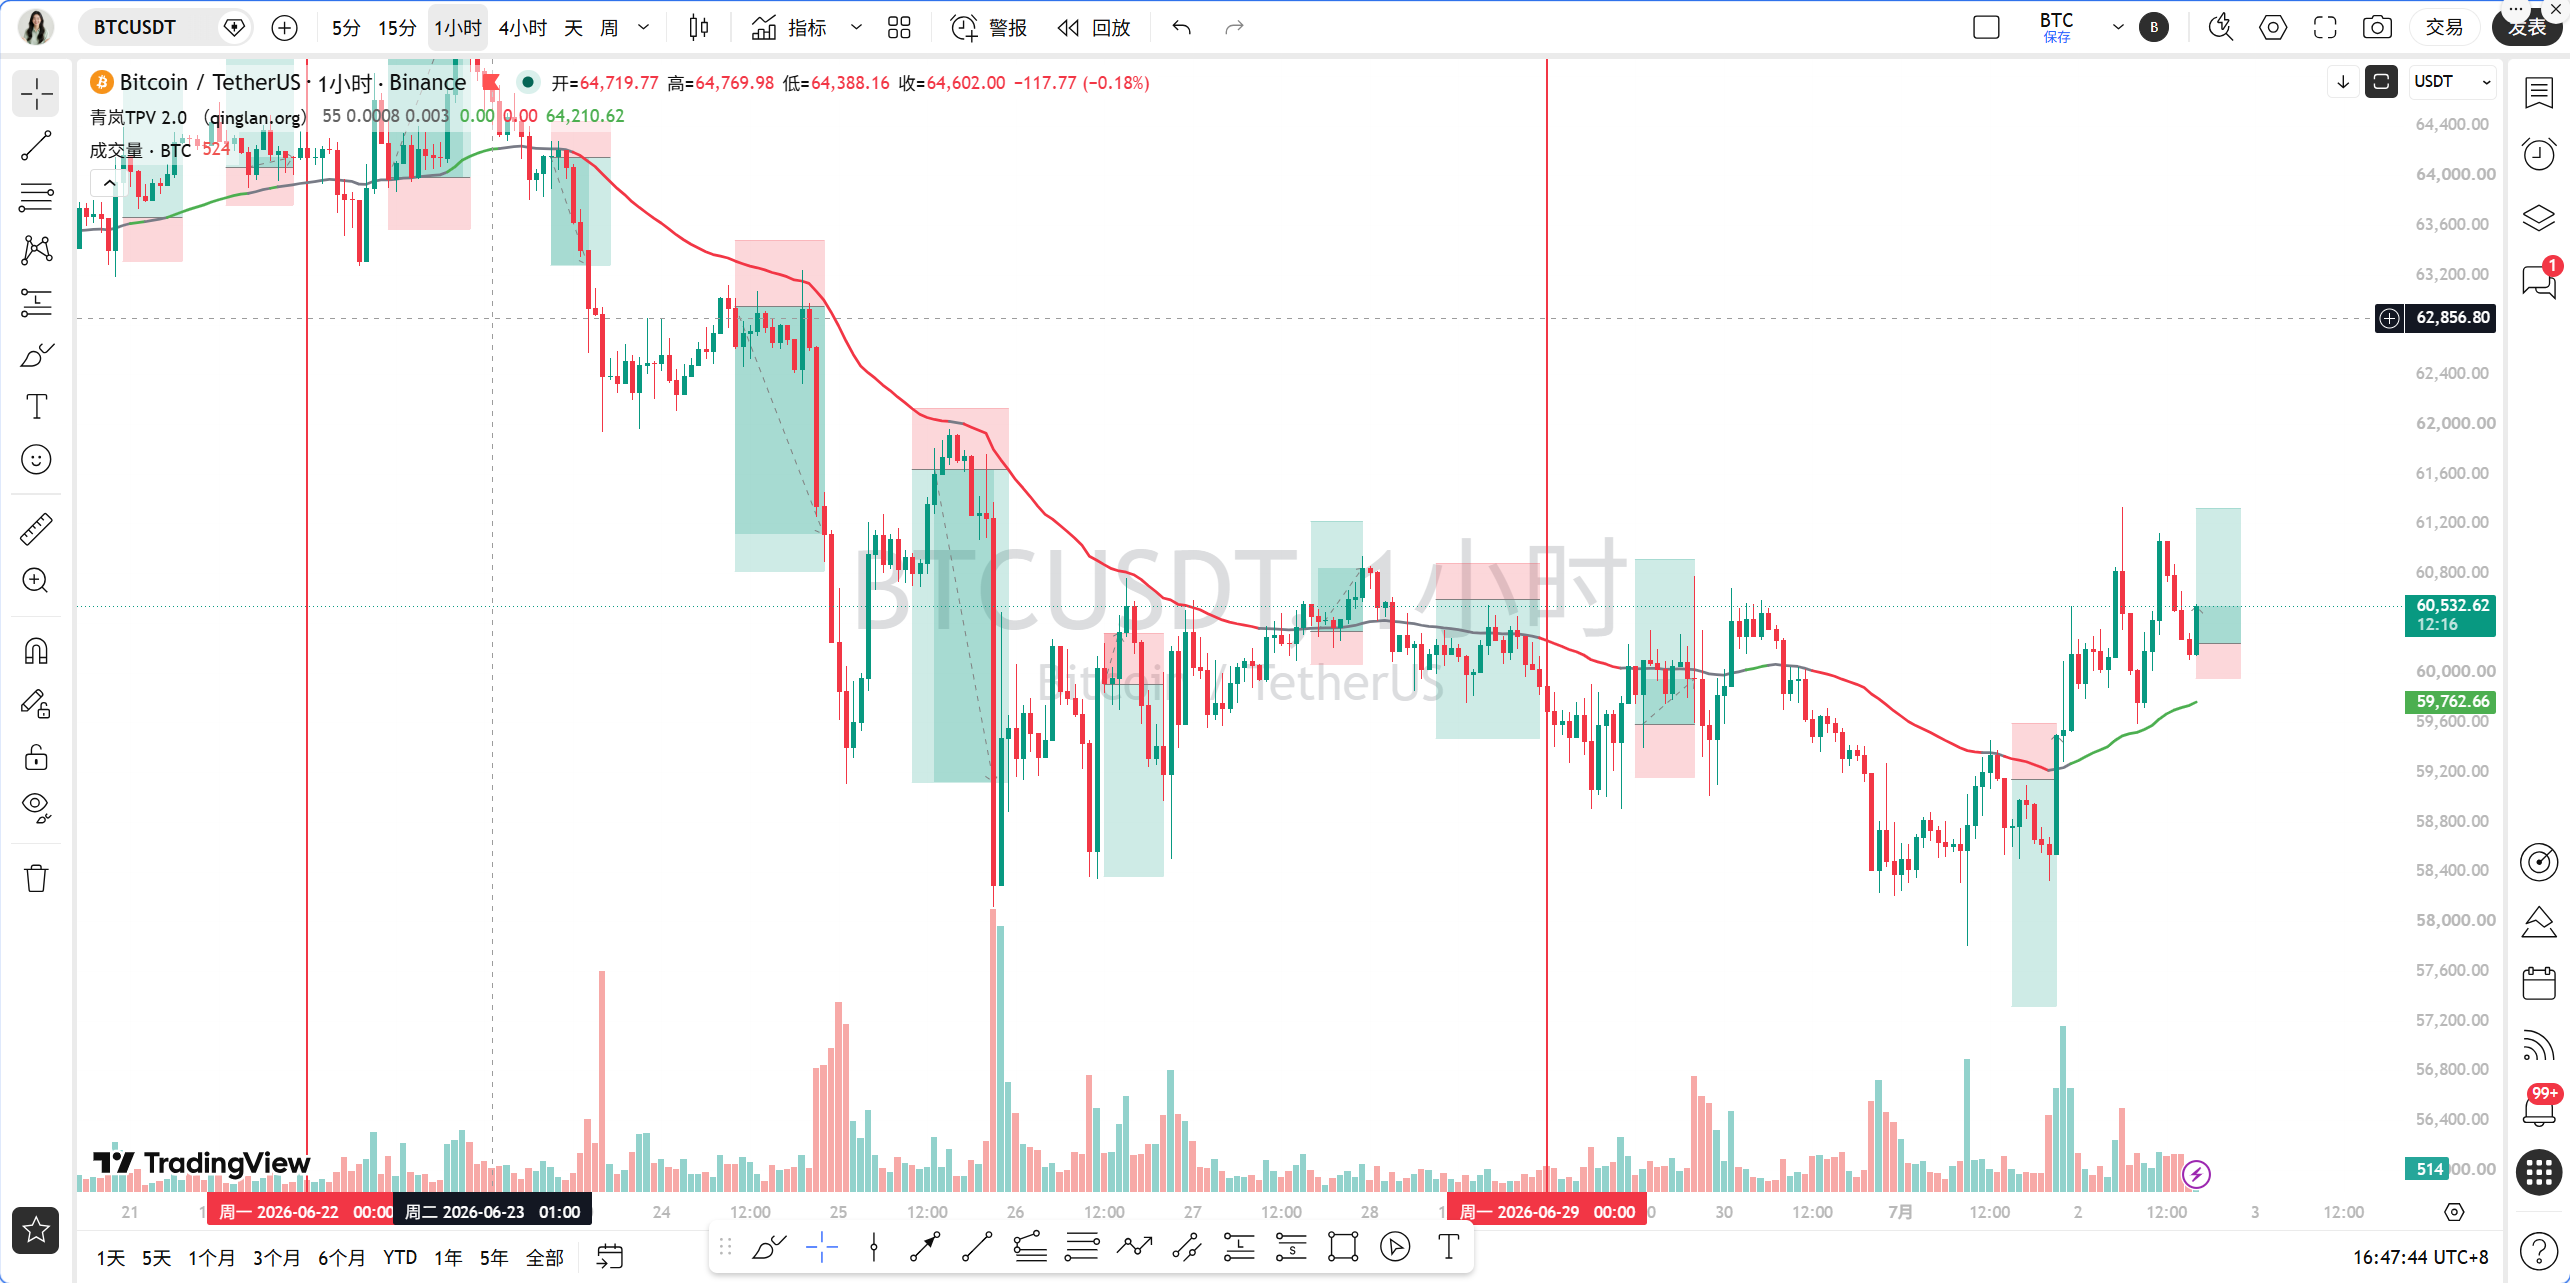
On the 1-hour chart, MA5 is at 60,443, MA10 is at 60,365, and MA30 is at 59,784, with the price running above all moving averages. EMA55 is at 59,727, and the current price is 60,500, which is about 1.29% above EMA55. The MACD histogram is negative at -20.89; DIF and DEA have flattened after forming a death cross at a high level. The RSI is at 53.62. The 1-hour chart shows short-term pullback pressure, but the trend remains bullish.
On the 15-minute chart, MA5 is at 60,352, MA10 is at 60,311, and MA30 is at 60,485, with the price oscillating between the moving averages. The MACD histogram is negative at -13.55; DIF and DEA have crossed downwards, and the RSI is at 39.95, indicating weak short-term momentum.
Overall, the daily chart is forming a bottom, the 4-hour chart is bullish, the 1-hour and 15-minute charts have a pullback demand, and there is a contradiction across multiple cycles, but the overall direction is bullish.
TPV Signal Validation
Now let's use the Qinglan TPV system for validation. The 1-hour EMA55 is at 59,727, and the current price is 60,500, above EMA55. In the last 8 1-hour candles, the closing prices have been greater than EMA55 8 out of 8 times, with 0 crossovers, and the amplitude is 1.29%, which does not meet the oscillation threshold, indicating a one-sided bullish trend.
Conditions for going long: First, the price is stable above the 1-hour EMA55, with the closing prices of two consecutive candles greater than EMA55, which is satisfied. Second, support is stable; the recent low appeared around 59,500, followed by a long lower shadow rebound, forming a bottoming pattern, which is satisfied. Third, the downward momentum is exhausted; although the 1-hour MACD histogram is negative, it has narrowed from -25 to -20 over the last two cycles, and the RSI has risen from 45 to 53, which is satisfied. All three conditions are met, and the TPV system gives a bullish signal.
The conditions for going short are not satisfied because the price is above EMA55 and there have not been two consecutive closing candles below EMA55.
On-Chain/Funding Situation
In terms of on-chain data, the Fear and Greed Index is at 19, indicating extreme fear, a typical feature of a bottoming area. Long-term holders are starting to accumulate, which is a positive sign, showing that smart money is collecting chips at low levels. Whales have increased their holdings by staking 15,802 ETH over two days, worth $25 million, reducing market circulation and supporting ETH. The BTC ETF has seen a continued net outflow of $296 million, but the Ethereum ETF has seen inflows of $14.8 million against the trend, indicating that funds are shifting from BTC to ETH, potentially related to expectations of the Ethereum Glamsterdam upgrade. If the non-farm data is lower than expected, it will strengthen interest rate cut expectations, benefiting risk assets. The sharp decline in the Japanese and Korean stock markets may trigger short-term risk aversion, but the impact is limited.
Key Offensive and Defensive Levels
The key resistance above is at $61,000, which is the previous high point and also a psychological level. If it breaks and stabilizes, the next target is at $62,000, corresponding to the daily MA30 position. The key support below is at $59,700, corresponding to the 1-hour EMA55, which is the lifeline for bulls. If it breaks below 59,700, it may test $59,000, which is the 4-hour MA60 support level. Further support is at $58,000, the previous low.
Trading Thoughts
Direction: Bullish. Entry Conditions: Wait for the price to pull back to the 1-hour EMA55 area, around the $59,700-$59,800 range, showing a long lower shadow or bottoming signal while the MACD histogram starts to shorten and the RSI rebounds from around 50; entries can be made in batches. Set a stop loss below $59,500; if it falls below, it indicates that support has failed. The first target is $61,000, and the second target is $62,000. If the price directly breaks through $61,000 and stabilizes, one can chase long positions, setting a stop loss at $60,500 with a target of $62,000. If the price breaks below $59,700, abandon the bullish thought and turn to wait-and-see.
Risk Warning
Market volatility may increase before the non-farm data is released, so be careful in managing positions and avoid heavy speculative bets.
If you want to know the exact entry positions, please follow the official website of the Qinglan Crypto Classroom: https://www.qinglan.org/
📊 Qinglan TPV Trading Strategy Backtest Reference
🕒 Last backtest time 07-02 07:00:01
Total analysis: 2654 Backtest: 2064 Accuracy rate: 73.6% (1519/2064)
免责声明:本文章仅代表作者个人观点,不代表本平台的立场和观点。本文章仅供信息分享,不构成对任何人的任何投资建议。用户与作者之间的任何争议,与本平台无关。如网页中刊载的文章或图片涉及侵权,请提供相关的权利证明和身份证明发送邮件到support@aicoin.com,本平台相关工作人员将会进行核查。