Cryptocurrency Circle Scholar: 7.2 Bitcoin (BTC) poised to launch, is a major market trend about to unfold? Latest market analysis and operational advice explained
The current price of Bitcoin is 59800. In recent times, I have stepped into several traps. Knowing clearly that it is a volatile market, I still cannot help but chase highs and sell lows, thinking I can catch the lowest point, but each time I am swept back and forth to trigger my stop loss. Holding a long position fearing a drop, holding a short position fearing a surge, my mindset is completely led by the market. It wasn't until later that I realized, in such a stagnant market, controlling my actions is more important than anything else. Rather than frequently trading and incurring transaction fees, it's better to patiently wait for a clear direction. In the cryptocurrency world, surviving is the hard truth; going slowly might lead to going further.
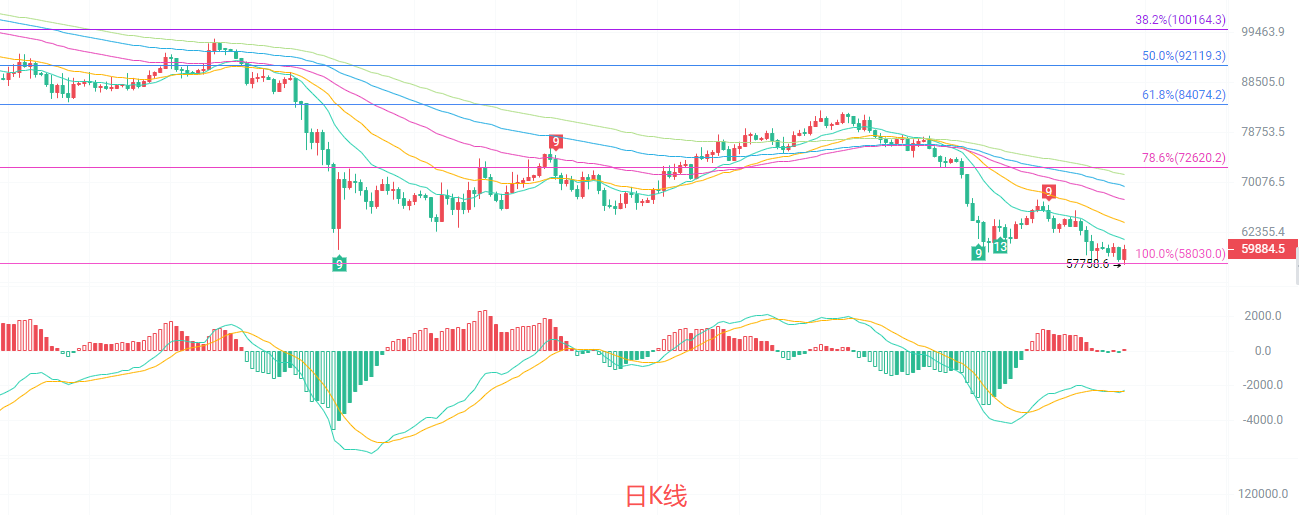
The daily K-line continues to face key resistance levels above in the 60600-61000 range, with support levels near 58000 below. The current price is operating below multiple EMA moving averages, and the downtrend arrangement has yet to change, indicating that the mid-term trend remains weak. The MACD indicator is operating below the zero line, with signs of diminishing volume, yet there has not been a clear golden cross reversal signal. The Bollinger Bands are continuously narrowing, signaling that the breakout window is approaching, and both sides are brewing a new game, with the short-term direction still unclear, necessitating close attention to volume cooperation.
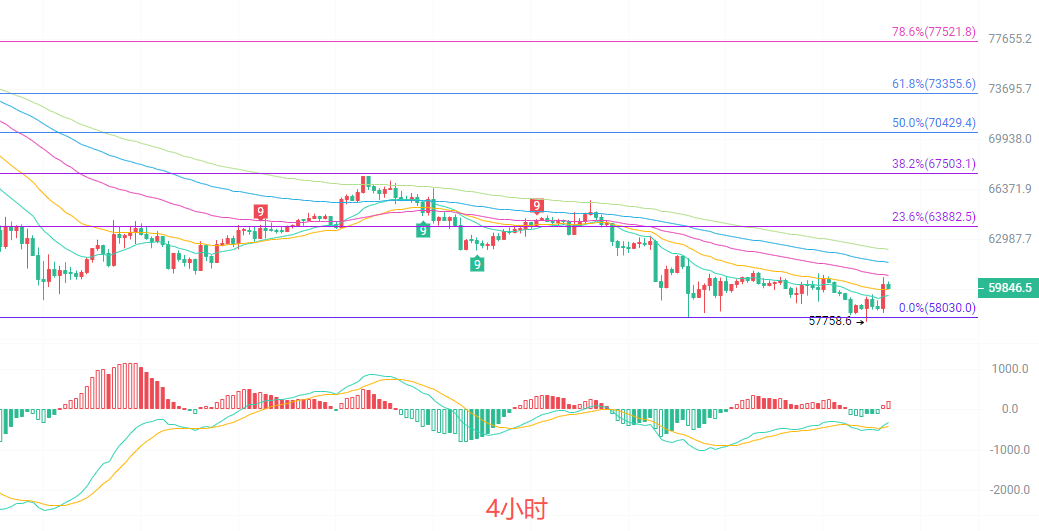
The four-hour K-line has started a small rebound from the previous low around 57758, currently standing above the lower Bollinger Band, attempting to challenge the middle band at 60675. The short-term EMA moving averages still maintain a downward arrangement, with the price constrained by multiple moving averages such as EMA30 and EMA60, casting doubt on the continuity of the rebound. The MACD indicator's green bars continue to shorten, and the DIF has started to turn upwards towards the DEA, indicating that the upward momentum is somewhat restored. However, overall, the price is still in a downward channel, with the Fibonacci 23.6% level at 63882 marking strong resistance. Only a breakout on increased volume above this level can reverse the short-term downturn; otherwise, the rebound is likely just a technical correction.
Short-term reference:
If below 59000 to 58500 does not break and prices rise, stop loss at 58000, target 60000 to 61000
If above 61000 to 61500 does not break and prices drop, stop loss at 62000, target 60000 to 59000
Specific operations should be based on real-time market data; more information details can be consulted with the author. The article publication is delayed; advice is for reference only, with risks borne by the reader.

Kind reminder: The above content is solely created by the author for the public account. The advertisements at the end of the article and in the comments section are not related to the author; please discern carefully. Thank you for reading.
免责声明:本文章仅代表作者个人观点,不代表本平台的立场和观点。本文章仅供信息分享,不构成对任何人的任何投资建议。用户与作者之间的任何争议,与本平台无关。如网页中刊载的文章或图片涉及侵权,请提供相关的权利证明和身份证明发送邮件到support@aicoin.com,本平台相关工作人员将会进行核查。