In the morning, Bitcoin fell to 57800, and now it has rebounded to around 58800; is the bullish buying power completely unable to hold up, rendering the rebound completely hopeless? If the support at 58000 is effectively broken, will it lead to a sharp plunge directly down to 54000?
Today, I will clarify the situation combining the market, chips, and on-chain data. The bullish buying has indeed continued to weaken, but that doesn't mean the market is going to collapse immediately; however, once there is a significant drop below 58000, a rapid decline towards 54000 is highly likely.
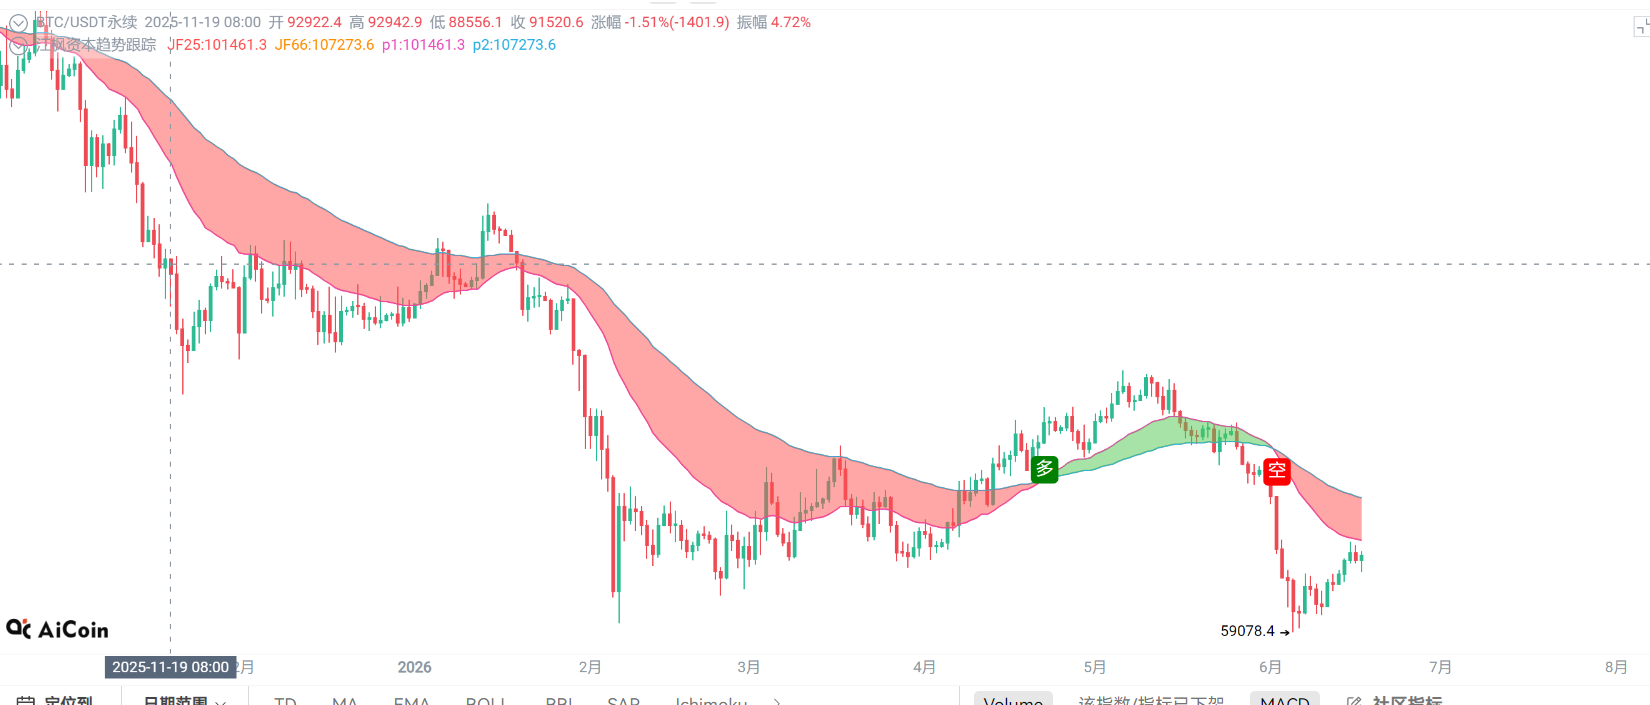
First, let's talk about the current real situation of the market: the bulls still have sporadic support, but the strength has long been lacking, and it is completely at the end of its rope. The market has dropped from last week's high of 62000, with the four-hour rebound highs getting lower with each iteration: 62000→61000→60200, and now it has directly fallen to 58600, a standard pattern of diminishing bullish rebound strength, where each upward move is shorter-lived. Currently, the bears are not aggressively smashing the market either; they are just placing high orders waiting for support to fail without collectively applying pressure, so a significant downward trend has yet to be established.
Now, let's discuss the significance of the 58000 threshold; this is a key defensive line with three layers of support: the 0.382 Fibonacci retracement line, the institutional accumulation cost concentrated at the end of last year, and the on-chain large holders' accumulation zone. Last week, the price had three dips down here, and there was buying pressure that pulled it back each time, forming a triple bottom pattern, proving that there is indeed support here. However, the key point is that the support has been tested three times, and each dip consumes a large amount of bullish buying power, which only weakens the support. Having relied on the bottom buyers three times, if there is another deep dive, it will be challenging to have enough capital to support it again. Additionally, whale positions have begun to loosen, with major holders reducing positions by 0.37% after June 15, while retail investors are increasing positions against the trend. Continuous large outflows and retail buy-ins; this structure of holdings has never been a bottom signal.
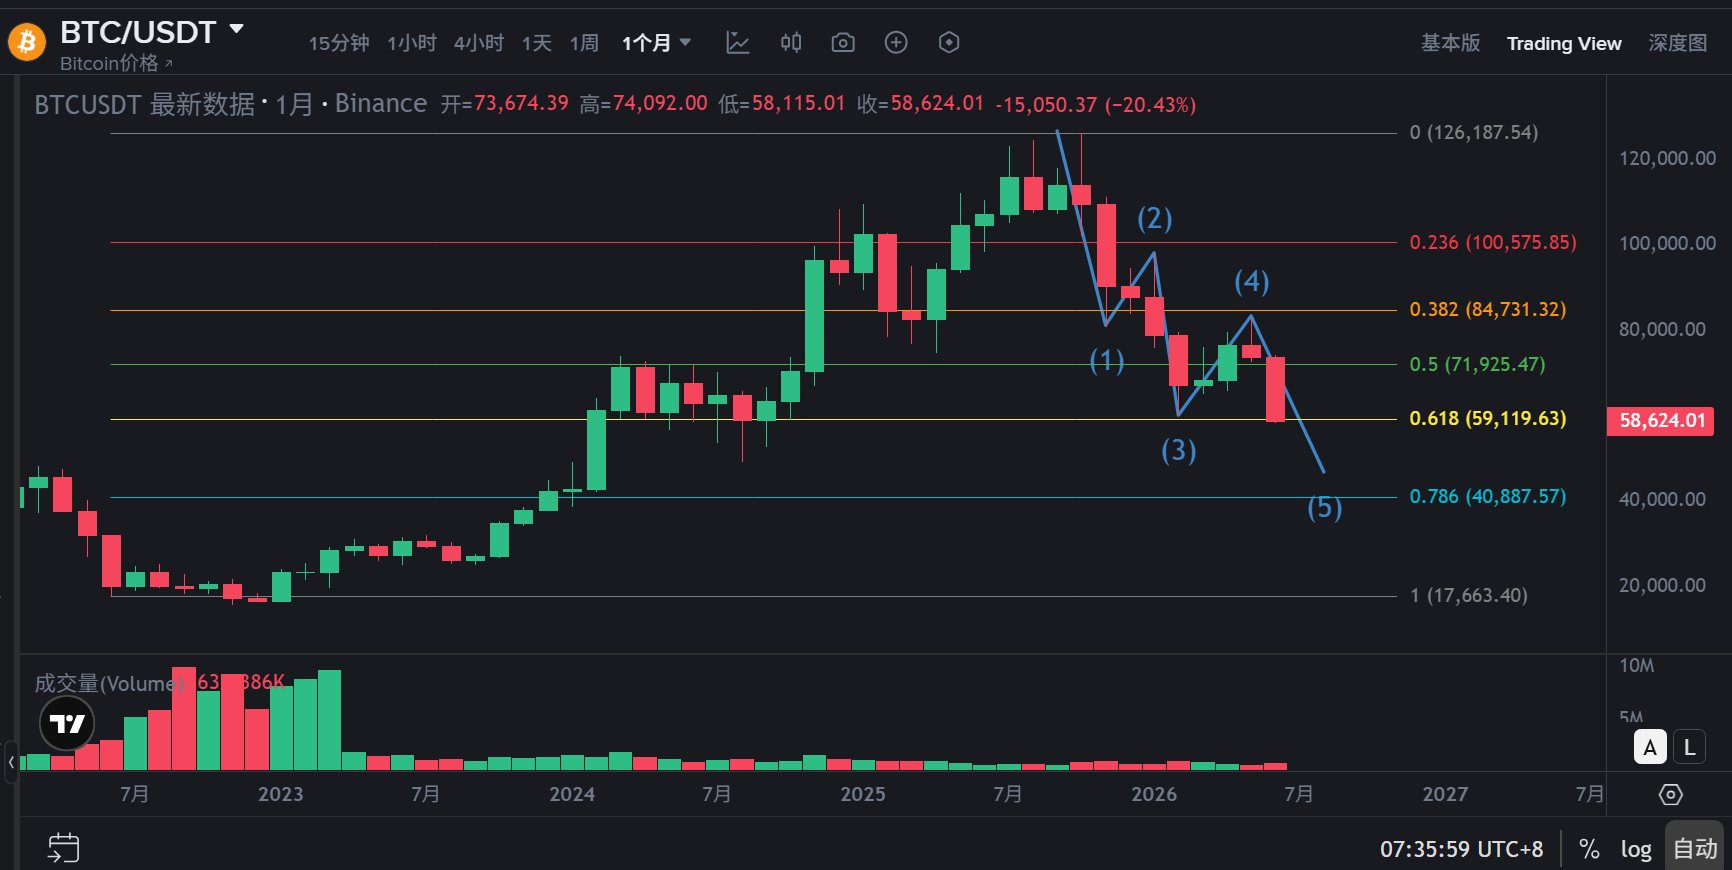
If we extend the cycle to the monthly chart, 58000-60000 is the current dividing line between bulls and bears. June's monthly decline reached 18.5%, marking the largest monthly drawdown since 2022, and the monthly chart closed with a large solid bearish candle, directly confirming a medium to long-term bearish pattern. Remember the trading logic: the monthly chart sets the downturn space, the weekly chart defines the overall trend, and the daily chart captures short-term rhythms, and currently, all three cycles are leaning bearish. The daily support at 58000 has been tested multiple times, but the bullish supporting power is diminishing with each iteration.
What will happen if the market volume breaks below 58000? Once the 4-hour chart closes with a solid bearish candle and crosses below 58000 with volume, the triple bottom support structure will directly fail, and the market will begin to accelerate downward. From a technical perspective, the 4-hour double arc top overlaid with the daily bearish flag pattern, the resonant target all points to the 54000 area; at the same time, the on-chain MVRV cost support range just falls in the 53390-54000 zone, where technical indicators and on-chain data resonate, which is no coincidence. 54000 is an essential cost support zone and the core target of this downward trend, not merely a temporary mid-level support.
Here’s a well-organized practical response strategy: 1. If the 4-hour volume closes bearish and effectively breaks below 58000: follow the trend and open a short position, first target 54000-55000; 2. If it only slightly pierces below 58000 on low volume and then quickly recovers: maintain a wait-and-see approach, do not rush to act; 3. If subsequent rebounds encounter resistance in the 60000-60500 range: you can increase your short position, first observing the breaking of 58000, and after the break, hold to look toward 54000-55000.
The core operational thought: wait for the 58000 support to clearly show strength or weakness, and confirm the breakout signal before entering a position, do not preemptively gamble on a one-sided market.
Good information is hard to come by, please like and share to follow the latest capital flows. Q: 1126708898
WeChat Official Account: Big Bull Talks Market
Disclaimer: This is only a personal market recap and does not constitute investment advice. Cryptocurrency is highly volatile, and contract trading carries high risks, please manage your positions reasonably.
免责声明:本文章仅代表作者个人观点,不代表本平台的立场和观点。本文章仅供信息分享,不构成对任何人的任何投资建议。用户与作者之间的任何争议,与本平台无关。如网页中刊载的文章或图片涉及侵权,请提供相关的权利证明和身份证明发送邮件到support@aicoin.com,本平台相关工作人员将会进行核查。