Over the weekend, BTC slightly surged to around 61000. The market looks like it has a decent rebound momentum, but the four-hour trading volume plummeted significantly from 7769 to 437, a reduction of more than ninety percent.
Such an extreme decrease in volume is not a signal of upward accumulation but rather seems like an attempt to push up without additional capital following suit, indicating severe lack of momentum. Objectively speaking, the weekend market itself is light in trading, and the volatility is constrained, which is normal for a balanced bull-bear game.
Currently, the two core issues everyone is most concerned about are: can the 59000 level effectively hold? Is 62000 the endpoint of this rebound, or is it a mid-way consolidation zone?
Let's not rush into drawing candlesticks; let’s take a look at the macro fundamentals:
First, the Federal Reserve has sent a strong signal. The dot plot shows that nine officials believe there will still be interest rate hikes this year, and expectations for interest rate cuts this year have been completely wiped out. My own compiled macro bearish score is already maxed out at 5 points, indicating a strong suppressive structure. The underlying logic that high interest rates suppress crypto assets will not change because of a small daily rebound; pressure will exist in the long term.
Second, the US dollar index continues to strengthen. The dollar index has been rising from 100.60, firmly standing between 101 and 102, reaching a new high for the year. The correlation coefficient between the dollar and Bitcoin over 90 days is about -0.82, showing a high negative correlation. As long as the dollar continues to maintain above the 100 level, the rebound space for Bitcoin will be naturally limited, making it difficult to experience a significant soaring trend.
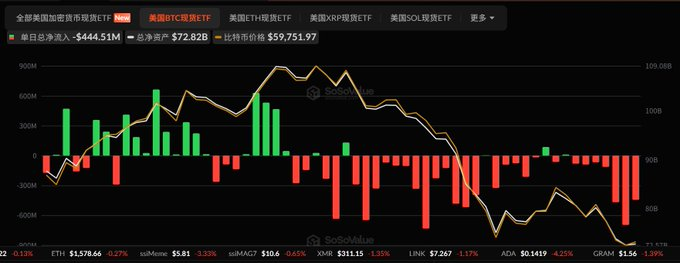
Third, funds from spot ETFs continue to flee, setting a record for historical outflows. In June alone, the cumulative net outflow reached 6.4 billion USD, refreshing the highest monthly outflow scale. On the 25th alone, there was an outflow of 696 million, with Fidelity's FBTC seeing an outflow of 274 million and BlackRock's IBIT seeing an outflow of 265 million; funds have been withdrawing for seven consecutive days, and on the 26th, BlackRock's IBIT alone had an additional outflow of 445 million USD. Institutional funds are continuously exiting, making it hard for any incremental funds to drive a strong market in the short term.
Everyone can take a look at the ETF capital flow chart, where institutional funds have continuously net flowed out over the past two months, with the chart showing red across the board.
Under the triple bearish pressure, the current rebound is merely a technical corrective movement, without any supporting conditions for a trend reversal.
From the market structure, there is indeed capital actively supporting the defense at around 58000, with three consecutive long lower shadows from June 24 to 26; the bears' attempts to push down have all been rapidly supported by buying pressures. Polymarket data shows that the market believes the probability of holding 58000 is as high as 86.8%, temporarily solidifying this support line.
Simply put, the constant pressure from above creates upper shadows, while repeated dips from below have all been supported; bears find it hard to break 58000 in a single attempt in the short term. However, the ongoing macro bearish sentiment makes it just a matter of time before 58000 is breached after multiple bearish tests.
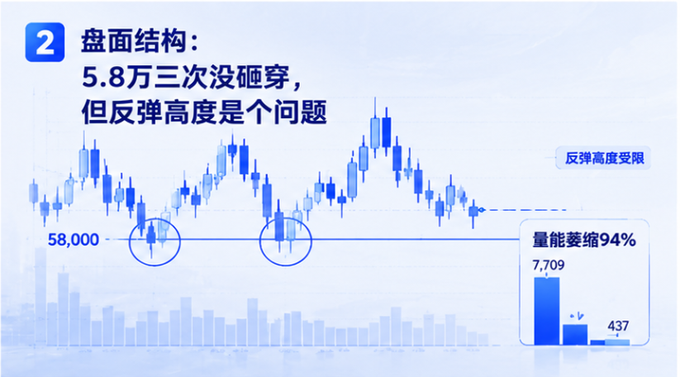
The real shortcoming lies in the rebound momentum. This round has seen a rebound from 58500 to 60583, with an overall increase of only 2083 points, failing to stabilize even the key 0.382 pressure level of 61000. Looking at the trading volume, the four-hour volume shrank drastically from 7769 to 437, a direct reduction of 94%, making the bullish momentum visibly fade after an attack.
It is true that there are buy orders supporting at 58000, but this batch of funds is only used for defensive support, showing no intention for active upward advancement. Being able to hold the bottom does not represent having the upward momentum; for a strong market, there must be incremental funds to drive the movement, yet currently, the market's incremental funds continue to flow out.
Is 62000 the ultimate pressure point for this round of rebound?
First, let's discuss the key pressure concentration range: 61950 is the 0.382 Fibonacci retracement line, and the 62200–62400 level is under pressure from the 200-week moving average, while the 62000–63000 zone is an area of previous capital accumulation, with three key resistances congested in the same range, making 61500 to 62000 equivalent to a heavy pressure wall. Currently, the bullish volume cannot keep up, and without major favorable catalysts, it will be hard to overcome this barrier smoothly.
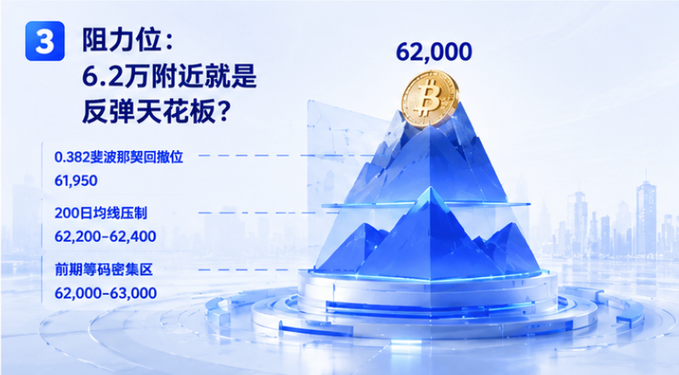
Looking at each resistance separately may not seem strong, but when three of them overlap, the suppressive force is magnified. For bulls to effectively break through means simultaneously overcoming three defensive lines; the required trading volume is far greater than that of the bounce to 61000.
Observing the diminishing strength of the rebound wave, the movement signals are very intuitive: the first wave rose from 58500 to 60583, an increase of 2083 points; the second wave rebounded from 59556 to 60941, rising only 1385 points, leaving only 66% of the strength of the first wave.
Based on this continuing weakening trend, the normal high point for the third rebound is expected to be in the 60900–61200 range. To reach 61500 or even challenge 62000, this decreasing momentum trend must be broken.
This diminishing trend is difficult to reverse out of thin air, essentially due to the continuous consumption of buy orders; each rebound leaves less available capital, with each subsequent rise becoming weaker. Unless a large volume bullish candlestick emerges on Monday, genuinely bringing in incremental funds to change the weak structure, otherwise, 62000 is basically the theoretical top of this round's rebound.

This week, there are four potential scenarios for BTC market movements, without specific order of occurrence, and each movement has corresponding triggering prerequisites:
The first scenario, with the highest probability at about 45%. The market trades in a narrow range between 60000-61000 with no incremental funds entering, and after a period of volatility, it retreats again to re-test the 58000-59000 support. The logic is straightforward: the bulls don't have enough funds to push upwards, and the bears also lack concentrated power to hammer down, leading to a persistent grinding of the market.
The second scenario, with a probability of 35%. The market breaks above 61000 with increased volume, pushing up to the 61500-62000 range, but faces resistance and retreats at the 62000 multi-layer pressure level. To trigger this rebound, the prerequisite is to close a large bullish candlestick on Monday, completely changing the volume contraction and weakness from the weekend; if Monday sees continued volume contraction during fluctuations, this scenario can basically be ruled out.
The third scenario, a low probability market at only 15%. The market breaks through 62500 with increased volume, pushing up to 63670, and in extreme situations hitting 65000. This requires three favorable conditions to coincide: a return of funds to ETFs, the stability of the US stock market, and continued volume growth in the market; without any of these conditions, it will be tough to achieve. If this strong upward movement happens, the short-term bearish mindset will need to be completely revised.
The fourth scenario, a black swan movement, with a probability of 5%. A direct effective break below the 58000 support, deeply probing into the 54000-55000 range. This typically requires a catalyst from negative events, such as a significant drop in the US stock market or an accelerated mass outflow of ETF funds to trigger.
Quality content is not easy to come by; please like and share, and follow for the latest fund flows. q: 1126708898
Disclaimer: This is merely personal market analysis and does not constitute investment advice. Cryptocurrency is highly volatile, and contract trading carries significant risks; please manage your positions reasonably.
免责声明:本文章仅代表作者个人观点,不代表本平台的立场和观点。本文章仅供信息分享,不构成对任何人的任何投资建议。用户与作者之间的任何争议,与本平台无关。如网页中刊载的文章或图片涉及侵权,请提供相关的权利证明和身份证明发送邮件到support@aicoin.com,本平台相关工作人员将会进行核查。