Dear friends, I am Sister Qinglan. Today, the market sentiment is complex, and two pieces of news from the focus headlines are worth paying attention to. First is the institutional bottom-fishing signal; Ark Invest has once again bought $16.9 million worth of stocks including Coinbase, which shows that professional funds are positioning themselves at low levels, boosting market confidence. Second is the regulatory pressure; the SEC has imposed a final fine of over $5 million in the NanoBit cryptocurrency fraud case, coupled with the imminent full effect of MiCA, European users are facing platform migration, and these events combined have increased short-term uncertainty. In a market of extreme fear, we need to talk with data rather than be swayed by emotions.
Current price and time
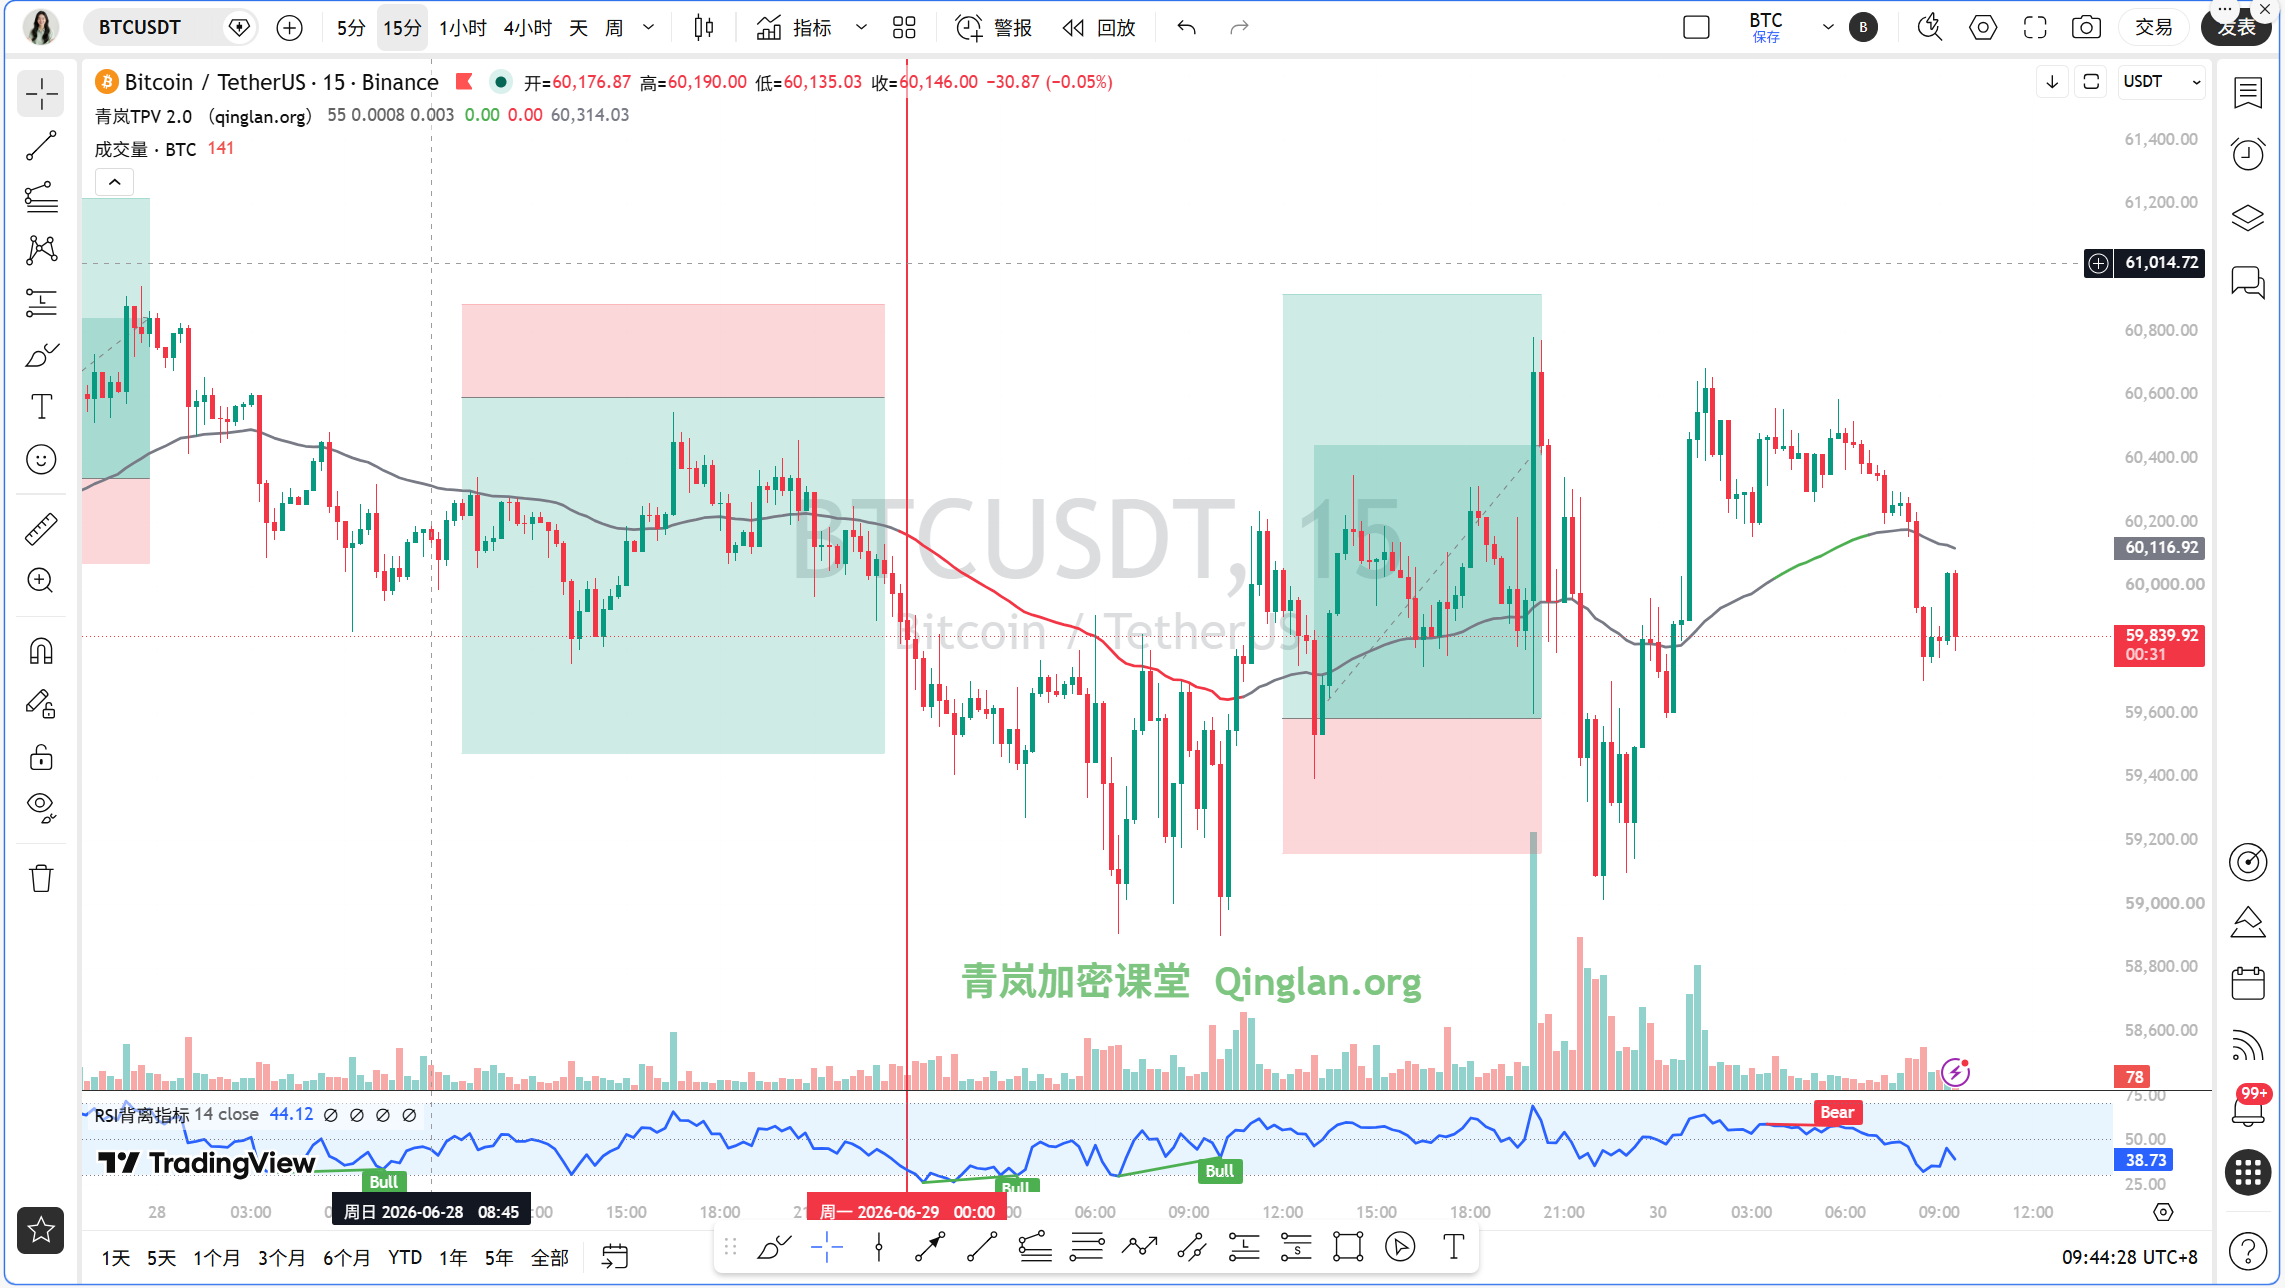
The current time is June 30, 09:43, and the price of Bitcoin is reported at 59843 USDT. The 24-hour increase is only 1.2%, but the fear and greed index has dropped to 15, in the extreme fear range. Is this position an opportunity or a trap? Let's break it down step by step.
Multi-cycle status overview
First, look at the daily level. The daily MA5 is at 59961, MA10 at 61074, MA30 at 63108, with the price clearly under pressure below the moving averages. The MACD's DIF is -2266.97, DEA is -2300.11, and the histogram value is 33.14; although the histogram value has slightly rebounded, it still remains below the zero axis, indicating the bearish trend has not changed. RSI is at 25.50, entering the oversold area, which usually means an increased probability of a short-term rebound, but a trend reversal requires time.
Switching to the 4-hour cycle. MA5 is at 60063, MA10 at 59934, MA30 at 60146, with the price oscillating near the moving averages. The MACD's DIF is -282.93, DEA is -381.26, and the histogram value is 98.33, with the histogram value being continuously positive, indicating a weakening of the downward momentum. RSI is at 44.97, in a neutral to weak region.
The 1-hour cycle is the focus for today. MA5 is at 60154, MA10 at 60210, MA30 at 59918, with the price hovering near MA30. The MACD's DIF is 56.35, DEA is 71.82, and the histogram value is -15.47, having formed a death cross, which is a short-term bearish signal. RSI is at 47.87, in a neutral area. EMA55 is at 60004.20, and the current price of 59843 is below EMA55, indicating a prevailing bearish trend.
The 15-minute cycle shows short-term oversold conditions. MA5 is at 59865, MA10 at 60020, MA30 at 60262, with the price breaking below all moving averages. The MACD's DIF is -98.80, DEA is -40.45, and the histogram value is -58.35, with bearish momentum continuing. RSI is at 24.73, entering the oversold zone, suggesting a demand for a short-term rebound.
TPV signal verification
Based on the Qinglan TPV system, we take the 1-hour EMA55 as the dividing line for bullish and bearish positions. The current price is 59843, below EMA55 of 60004.20, confirming the bearish trend area. The oscillation auxiliary data shows that in the past 8 one-hour K-lines, the closing price was greater than EMA55 6 times, crossed once, and the price distance from EMA55 is 0.27%, less than the 0.3% threshold, indicating line-hugging volatility, increasing the probability of oscillation. This suggests that although the bearish trend is dominant, the price is closely sticking to the moving average and may enter a period of consolidation.
Short-selling condition check: First, the price is under pressure below the 1-hour EMA55, with 2 consecutive one-hour closing prices below EMA55, conditions are satisfied. Second, pressure meets resistance, requiring long upper shadows or top formations. Currently, on the 15-minute and 1-hour charts, the price has been blocked several times near 60000, forming a minor top formation, but with limited amplitude. Third, the rebound is weak, with the MACD histogram shortening for 2 consecutive periods; the 1-hour MACD histogram value is from -12.35 to -15.47, still expanding, not meeting the shortening condition. Therefore, short-selling conditions are incomplete, and the system does not actively short.
Long position condition check: First, the price is not stable above the 1-hour EMA55, current conditions do not satisfy this. Second, support stabilizes, the 15-minute RSI is oversold, but there has not been a clear long lower shadow or bottom formation. Third, the downward momentum has not weakened, with the MACD histogram not shortening consecutively. Therefore, long position conditions are also not satisfied.
In summary, the current situation is an oscillation in the bearish trend, and the system suggests no active long or short positions, only providing a range. This is the discipline that Qinglan's cryptocurrency classroom emphasizes repeatedly: when the trend is unclear, waiting is more important than acting.
On-chain/fund aspect
In terms of on-chain data, the fear and greed index is at 15, which is extremely fearful; historically, this position often corresponds to phase lows, but there may still be further declines in the short term. The market share of Bitcoin is 55.67%, indicating that funds are still seeking refuge in Bitcoin. In the focus news, Ark Invest's bottom-fishing behavior is a positive signal, but FG Nexus has sold 3375 ETH at a loss of over $86.8 million, indicating that large holders are still deleveraging. On the macro front, Bank of America warns that the S&P 500 could retract by 8%, and the Fed's hawkish policies suppress risk assets, all these factors increase market uncertainty.
Key attack and defense positions
The first resistance level above is at the 1-hour EMA55 of 60004, which is the dividing line between bullish and bearish. If the price stabilizes above 60000, the next resistance is near 1-hour MA10 of 60210 and MA30 of 59918. The support level below is at 59500, which is near the recent low; if broken, it may test 59000 or even 58000. The daily RSI is oversold, but the trend has not changed; the support level needs repeated validation.
Trading strategy
Direction: The current system determines it is an oscillation in a bearish trend, without actively going long or short. The operation is primarily to observe, waiting for clear signals.
Entry conditions: If the price rebounds to the 60000-60200 area and the 1-hour MACD histogram shortens for 2 consecutive periods, with the RSI recovering from the oversold area to above 50, consider lightly shorting. If the price breaks below 59500 with increased volume, one can chase short, but beware of oversold rebounds.
Stop-loss position: Stop-loss for short positions set above 60500; if the price breaks and stabilizes above the 1-hour EMA55, the short position must exit. No long positions are currently suggested unless the price stabilizes at 60000 and a bottom formation appears.
Target position: First target for shorts is 59500, second target is 59000. If the price stabilizes near 59500 and shows a reversal signal, consider closing positions and observing.
Risk warning
The current market is in extreme fear and line-hugging oscillation; any operation must strictly control position size to avoid chasing highs and cutting lows.
Follow Qinglan's cryptocurrency classroom to grasp more trading opportunities! Welcome to visit the official website www.qinglan.org
📊 Qinglan TPV trading strategy backtest reference
🕒 Last backtest time 06-30 07:00:02
Total analysis: 2606 Backtest: 2031 Accuracy: 73.2% (1486/2031)
免责声明:本文章仅代表作者个人观点,不代表本平台的立场和观点。本文章仅供信息分享,不构成对任何人的任何投资建议。用户与作者之间的任何争议,与本平台无关。如网页中刊载的文章或图片涉及侵权,请提供相关的权利证明和身份证明发送邮件到support@aicoin.com,本平台相关工作人员将会进行核查。