Cryptocurrency Scholar: On June 30, Ethereum (ETH) faces strong downward pressure with moving averages, and reversal signals are nowhere in sight? Latest market analysis reference
The current price of Ethereum is 1625. Let's discuss the current market sentiments of Ethereum and also review the recent trading rhythm. Since dropping from 2200, many people have been guessing the bottom, at 1800, 1700, 1600, each time believing the drop was over, only to be slapped in the face by new lows, learning from the market time and again. Currently, the signals from the market are very clear, with the daily line declining, and rebounds unable to even hold above short-term moving averages. In this kind of market, going long can only be treated as short-term speculation, and one must never hold heavy positions. The market is always full of opportunities; what is lacking is the ability to control risks.
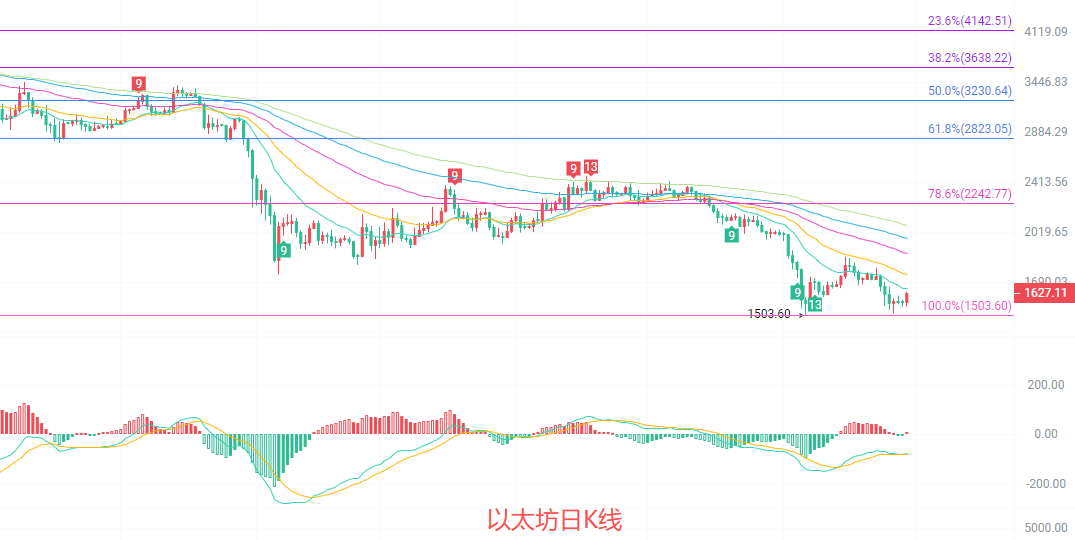
The daily candlestick is in a clear downward channel, and the current price is just above the previous low point at 1503 in a weak rebound zone. The moving average system is arranged downwards, with prices under pressure beneath the EMA15, EMA30, and EMA60, and the key resistance level above is in the range of 1735-1870. The MACD indicator's DIF and DEA are still operating below the zero line; although the green bars are converging, the downward momentum has not fully exhausted; there is short-term support forming around the lower Bollinger Band at 1534, while the middle band continues to decline, overall the trend is bearish, and the rebounds seem more like weak repairs rather than reversal signals.
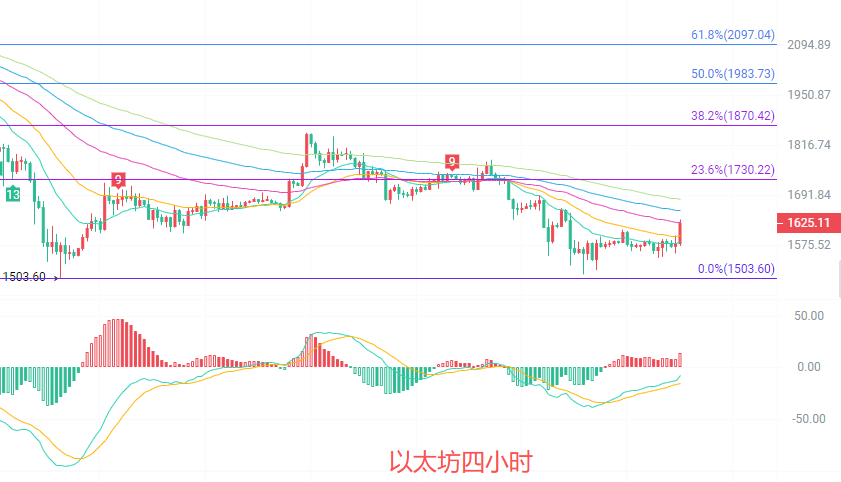
The four-hour candlestick is above the middle Bollinger Band at 1580, but there is clear pressure from the EMA15/30 moving averages above. The MACD indicator's DIF has crossed above DEA, forming a golden cross, and the red bars are continuously increasing, indicating the temporary release of short-term north-south momentum, but prices remain below the previous downward trend line, with the Fibonacci 23.6% resistance level around 1730 being a critical threshold. The Bollinger Band is showing signs of convergence, with short-term support forming near the lower band at 1556; if the price fails to break through 1730, it is highly likely to return to a weak oscillation and downward probing pattern.
Short-term reference:
If the price does not break below 1560 to 1520, target north to 1600 to 1660, with a stop loss of 50 points.
If the price does not break below 1700 to 1750, target south to 1650 to 1600, with a stop loss of 50 points.
Specific operations should be based on real-time market data. For more details, you can consult the author. Note that the article is published with a delay; it is recommended for reference only at your own risk.

Warm reminder: The above content is solely created by the author’s public account. The ads at the end of the article and in the comment section are unrelated to the author. Please discern carefully, thank you for reading.
免责声明:本文章仅代表作者个人观点,不代表本平台的立场和观点。本文章仅供信息分享,不构成对任何人的任何投资建议。用户与作者之间的任何争议,与本平台无关。如网页中刊载的文章或图片涉及侵权,请提供相关的权利证明和身份证明发送邮件到support@aicoin.com,本平台相关工作人员将会进行核查。