Cryptocurrency Scholar: Has the trend structure of Bitcoin (BTC) been set in motion since June 30? Latest market analysis
The current price of Bitcoin is 60500, and the recent market trend is a typical weak consolidation phase. Don't be fooled by a few small bullish candles; the moving averages are aligned downward, and the MACD rebound is weak. Before the trend reverses, all rebounds are opportunities to continue southward. The upward movement can only be a very short-term quick in and out, and short positions need to control positions and maintain stop-losses. The market will not rise just because you want it to; following the trend is key to survival.
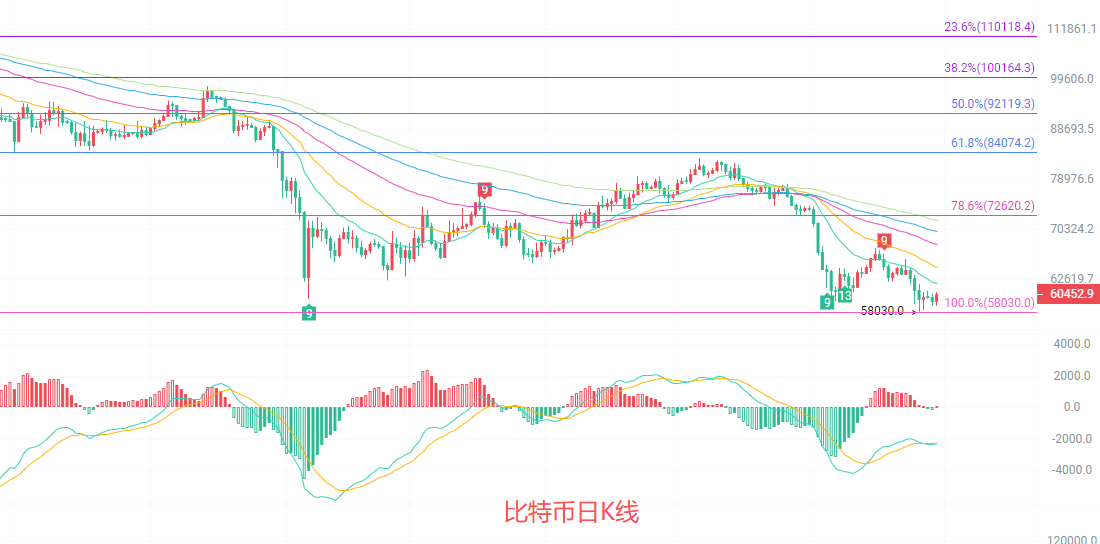
The daily candlestick chart is currently in a weak consolidation above the prior low of 58030. The EMA15 and EMA30 moving averages have turned downward, and the price is consistently suppressed by the moving averages, indicating a typical continuation of the southward trend. The MACD indicator shows a severe lack of upward momentum. The Bollinger Bands are continuously opening downward, with the price running near the lower band, indicating that the short-term downward strength remains dominant. Only a breakout above the EMA15 moving average near 62600 will provide an opportunity to reverse the weak trend; otherwise, there is a high probability of further testing the support levels.
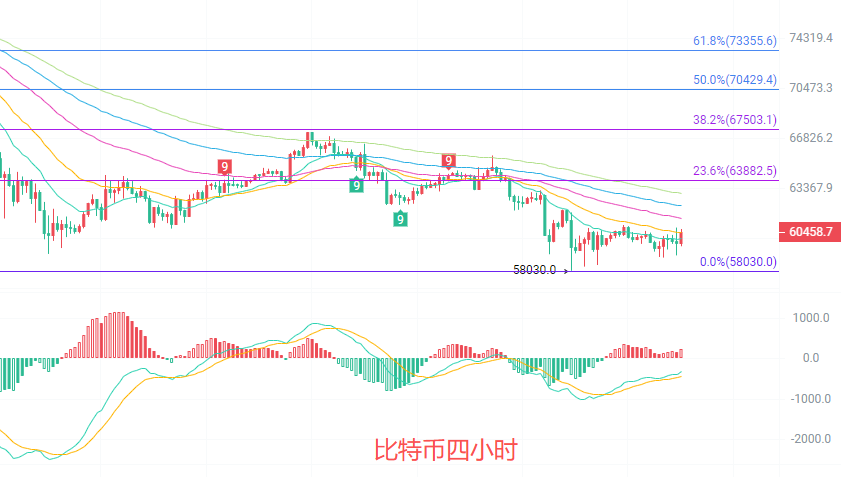
The four-hour candlestick chart is also being suppressed by all moving averages, including EMA15, EMA30, and EMA60, forming a standard southward arrangement. Every bounce to around EMA30 faces resistance and falls back, indicating heavy selling pressure above. Although the MACD indicator has shown weak red bars, the DIF remains below the DEA and is overall below the zero axis, indicating a weak rebound signal without signs of reversal. The Bollinger Bands are in a contracted state, with the price running below the middle band, and the short-term oscillation range is narrowing. The key range for the north-south battle lies between 60000 and 61000. Once it drops below 60000, it will most likely retest the support level of 58030.
Short-term reference:
If it does not break below 58500 to 58000, it goes north, stop-loss at 57500, target looking at 60000 to 61000.
If it does not break above 61000 to 61500, it goes south, stop-loss at 62000, target looking at 60000 to 59000.
Specific operations should be based on real-time market data. For more details, you can consult the author. The article is published with a delay, and is suggested for reference only; risks are borne by the reader.

Warm reminder: The above content is solely created by the author of the public account. The advertisements at the end of the article and in the comment section are not related to the author. Please be cautious in identifying them. Thank you for reading.
免责声明:本文章仅代表作者个人观点,不代表本平台的立场和观点。本文章仅供信息分享,不构成对任何人的任何投资建议。用户与作者之间的任何争议,与本平台无关。如网页中刊载的文章或图片涉及侵权,请提供相关的权利证明和身份证明发送邮件到support@aicoin.com,本平台相关工作人员将会进行核查。