Dear friends, I am sister Qinglan. Today the market sentiment is extremely pessimistic, and the fear and greed index has dropped to 12, which belongs to the extreme fear zone. In the focus news, the net outflow of Bitcoin ETFs in the United States for one week is $1.79 billion, creating the second-highest historical record, which directly suppresses the short-term rebound momentum of BTC. Meanwhile, South Korea's KOSPI plummeted by 3%, with technology stocks leading the decline, and the panic sentiment may spread to the cryptocurrency market, exacerbating selling pressure. These two bearish news combined indicate that the current funding and technical aspects are facing a severe test. But do not forget, Strategy holds 847,000 Bitcoins, and Michael Saylor hinted at continuing to increase holdings, suggesting that institutional long-term confidence remains. In our Qinglan crypto class, we have always emphasized that when the market is in panic, it is precisely the key moment for rational analysis.
Current Price and Time
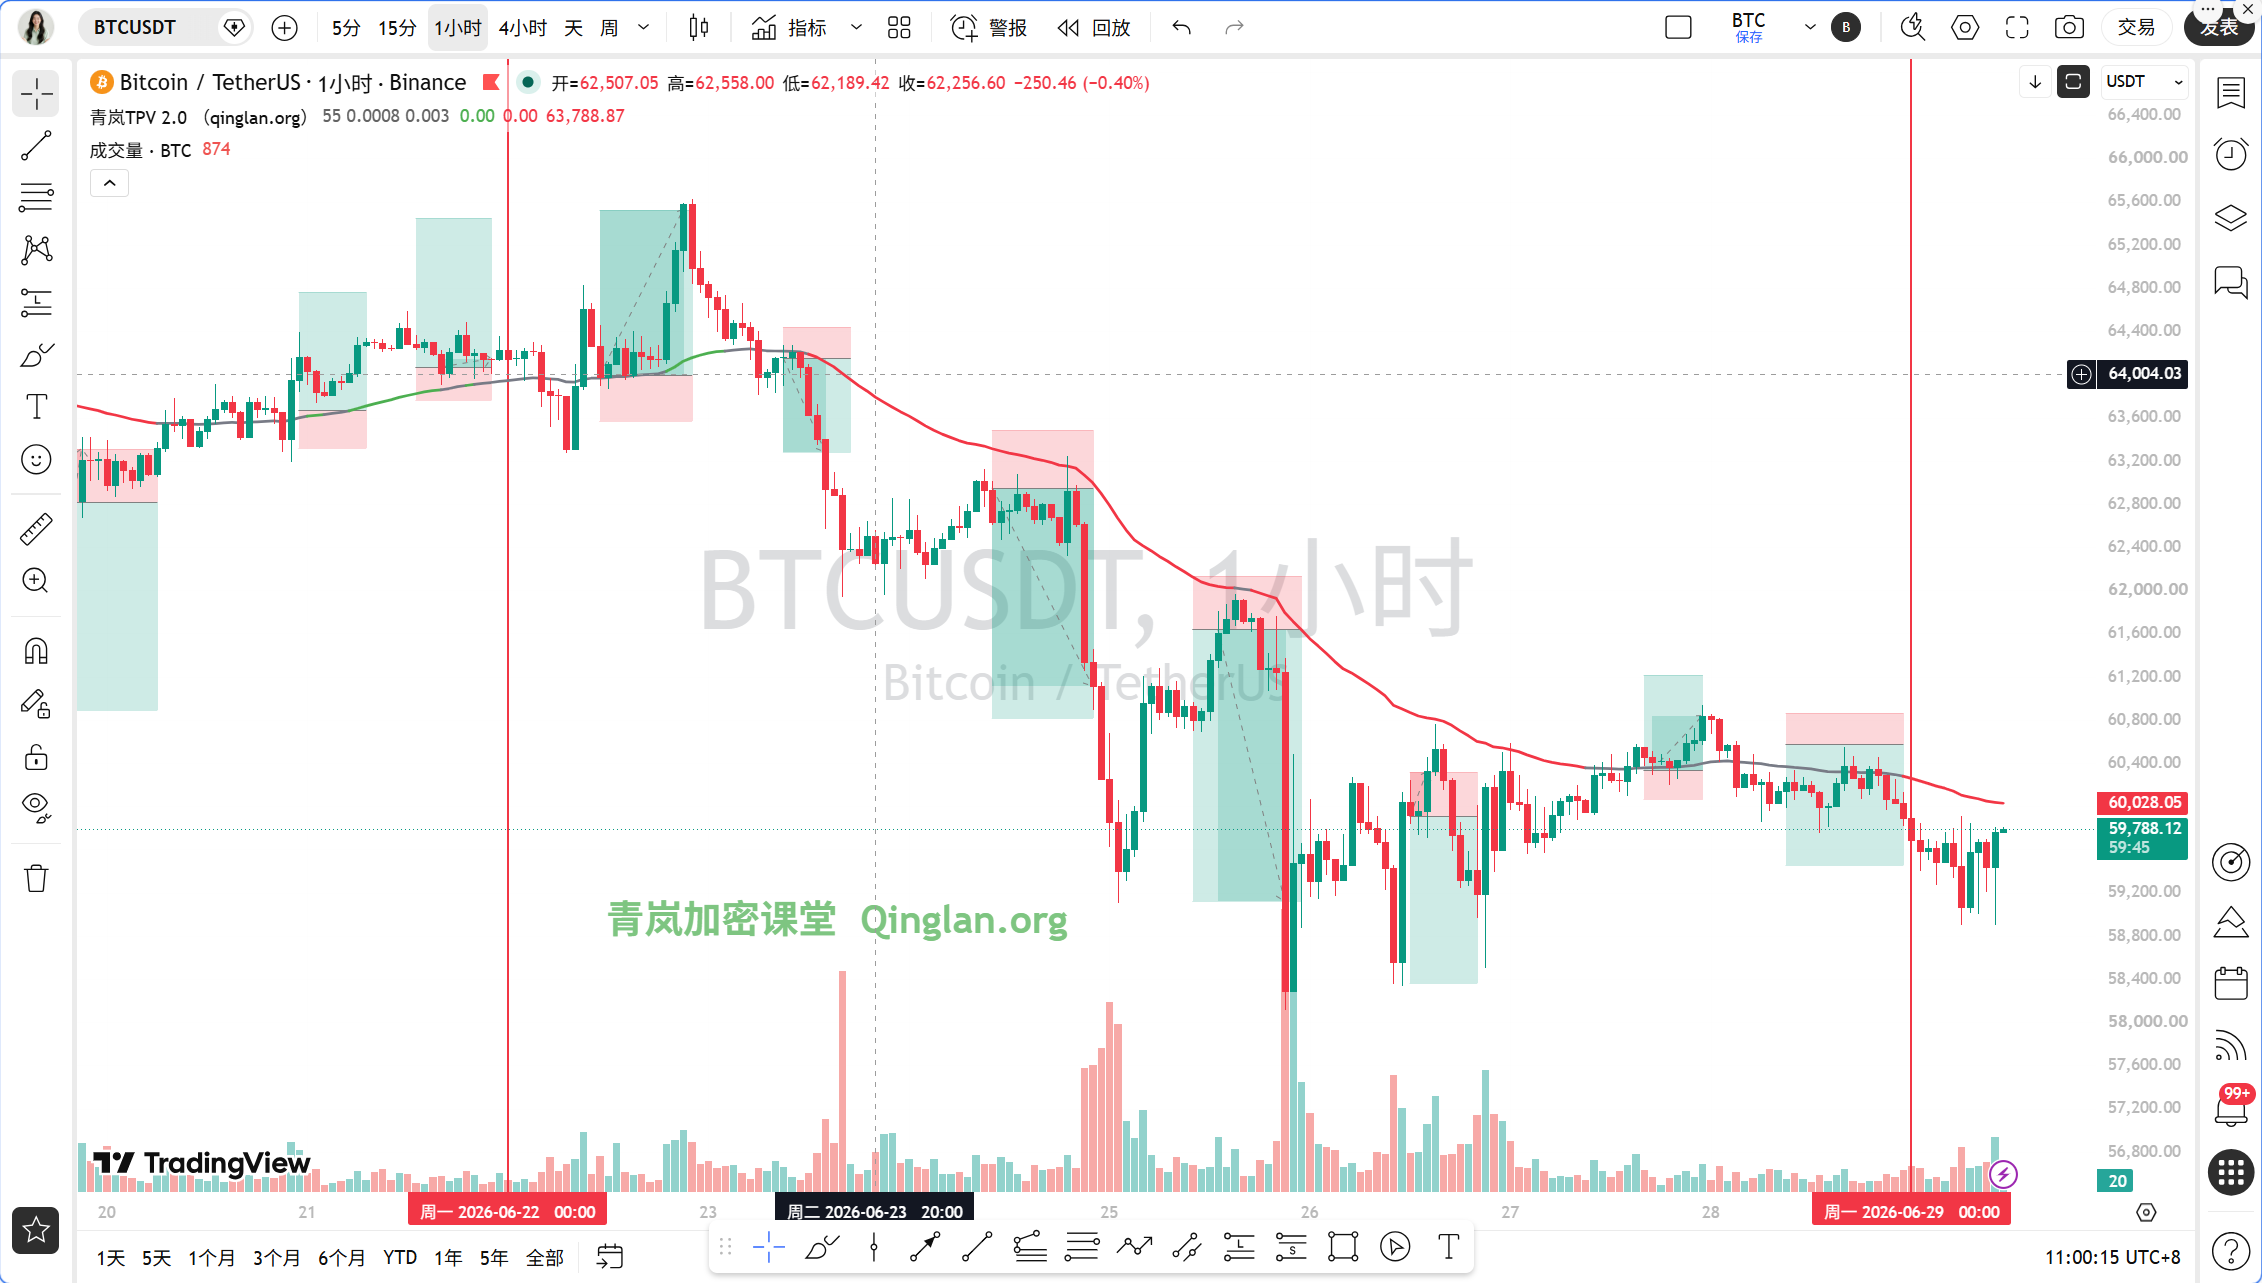
The current time is June 29, 11:00, and the BTC price is at 59,818 USDT. The 24-hour decline is 1.82%, with the price hovering below the 60,000 mark, and the market is in a weak oscillation pattern.
Multi-cycle Status Overview
On the daily level, MA5 is at 59,863, MA10 is at 61,475, MA30 is at 63,555, with moving averages in a bearish arrangement. The MACD's DIF is -2,342.69, DEA is -2,323.18, with a histogram value of -19.51, maintaining a dead cross state. The RSI is at 22.17, in the oversold area, but there is no obvious reversal signal. The overall bearish trend on the daily line is clear, with insufficient rebound momentum.
On the 4-hour level, MA5 is at 59,821, MA10 is at 60,057, MA30 is at 60,385, with the price running below the moving averages. The MACD's DIF is -477.68, DEA is -531.39, and the histogram value is 53.71. Although the histogram value has turned positive, both the DIF and DEA are still below the zero axis, indicating a weak rebound. The RSI is at 50.87, moderately weak.
On the 1-hour level, MA5 is at 59,652, MA10 is at 59,552, MA30 is at 59,918, with the price below MA30. The MACD has produced a golden cross, with DIF at -149.48, DEA at -167.78, and a histogram value of 18.30, indicating a short-term rebound attempt. However, the RSI is at 45.16, still below 50, with limited rebound strength. EMA55 is at 59,926.47, with price under pressure below it.
On the 15-minute level, MA5 is at 59,584, MA10 is at 59,535, MA30 is at 59,518, with the moving averages clustering together. The MACD's DIF is 16.68, DEA is -38.20, and the histogram value is 54.88, in a golden cross state, but with weak momentum. The RSI is at 51.49, neutral.
In summary, the daily line and 4-hour bearish trend dominate, while the 1-hour and 15-minute levels show short-term rebound signs, but with insufficient strength. Multi-cycle resonance is downward, and the rebound is merely a correction within the bearish trend.
TPV Signal Validation
According to the Qinglan TPV system, we use the 1-hour EMA55 as the dividing line for long and short positions. The current price of 59,818 is below EMA55's 59,926.47, indicating a bearish trend area.
Short Selling Condition Validation: First, the price is under pressure below the 1-hour EMA55, with the closing prices of the past 8 one-hour candles all below EMA55, meeting the condition. Second, resistance is met, with the price being blocked multiple times around 59,900, forming long upper shadows, meeting the condition. Third, there is weak rebound strength; although the 1-hour MACD histogram has shortened for 2 cycles, the RSI has risen from 45 to 51 without entering the overbought zone, indicating insufficient rebound momentum. Overall, the bearish signal is valid.
The auxiliary data for oscillation judgment shows that the closing prices of the past 8 one-hour candles above EMA55 are 0, with crossing counts at 0, and the price distance from EMA55 is 0.18%, less than 0.3%, indicating line-hugging fluctuations, increasing the oscillation probability. However, the current situation has not reached the oscillation threshold and is still viewed as a unilateral bearish trend.
On-chain/Funding Situation
The fear and greed index is 12, indicating extreme fear, with market sentiment at a freezing point. BTC's market share is 55.62%, showing that funds are still fleeing to BTC for safety, but overall liquidity is insufficient. ETF funds continue to flow out with a net outflow of $1.79 billion in one week, creating the second-highest historical record, putting short-term pressure on prices. Miner hash rate prices have plummeted by 18.34% in 30 days, increasing selling risk. However, Strategy continues to accumulate, indicating long-term funds are positioning at low levels. On-chain data shows mixed long and short signals, leaning bearish in the short term.
Key Support and Resistance Levels
The first resistance level above is at the 1-hour EMA55 of 59,926; if it breaks, watch the MA10 of 60,057 and MA30 of 60,385 on the 4-hour. The first support level below is at 59,500, where the 15-minute and 1-hour moving averages are dense; if it breaks, watch the integer level of 59,000 and the previous daily low around 58,000.
Trading Strategy
Direction: Primarily bearish, but beware of oscillation induced by line-hugging fluctuations.
Entry Conditions: Wait for the price to rebound near the 1-hour EMA55, around 59,900-59,950 area; if long upper shadows or top divergence appear, and the MACD histogram starts to shorten, you may short with a small position.
Stop Loss Level: Set above 60,200; if it breaks, the bearish logic is invalidated.
Target Levels: First target 59,500, second target 59,000; if it breaks below 59,000, it may reach 58,000.
If the price directly breaks below 59,500, you may short, with a stop loss set at 59,800 and a target of 59,000.
Risk Warning
The current market is in an extreme fear state, with price line-hugging fluctuations increasing the probability of oscillation, operate with a small position and strict stop loss.
Follow the Qinglan crypto class to seize more trading opportunities! Welcome to visit the official website www.qinglan.org
📊 Qinglan TPV Trading Strategy Backtest Reference
🕒 Last Backtest Time 06-29 07:00:01
Total Analysis: 2583 Backtests: 1999 Accuracy: 72.7% (1454/1999)
免责声明:本文章仅代表作者个人观点,不代表本平台的立场和观点。本文章仅供信息分享,不构成对任何人的任何投资建议。用户与作者之间的任何争议,与本平台无关。如网页中刊载的文章或图片涉及侵权,请提供相关的权利证明和身份证明发送邮件到support@aicoin.com,本平台相关工作人员将会进行核查。