Academician of the Coin Circle: What is the direction of the market change revealed by the dual-cycle resonance of Bitcoin (BTC) on June 29? Latest market analysis
The current price of Bitcoin is 59500, both bulls and bears are betting on the direction, no one can give you a 100% answer. Those who are trying to buy at the bottom are afraid it will continue to drop, while those who are short are afraid of a sudden surge. Essentially, they are all being led by emotions. Remember, the most useless thing in trading is "I think," and the most reliable thing is "I plan": Don't chase long positions if the resistance level is not broken, and don't buy the dip if the support level does not stabilize. Make sure to set stop losses for every trade, accept losses, and walk away with profits. Don't think about turning the situation around in one move, and don't stubbornly confront the market. If you oppose the market, it will only cause you to lose even more. Never put your own capital at risk by betting on uncertain emotions.
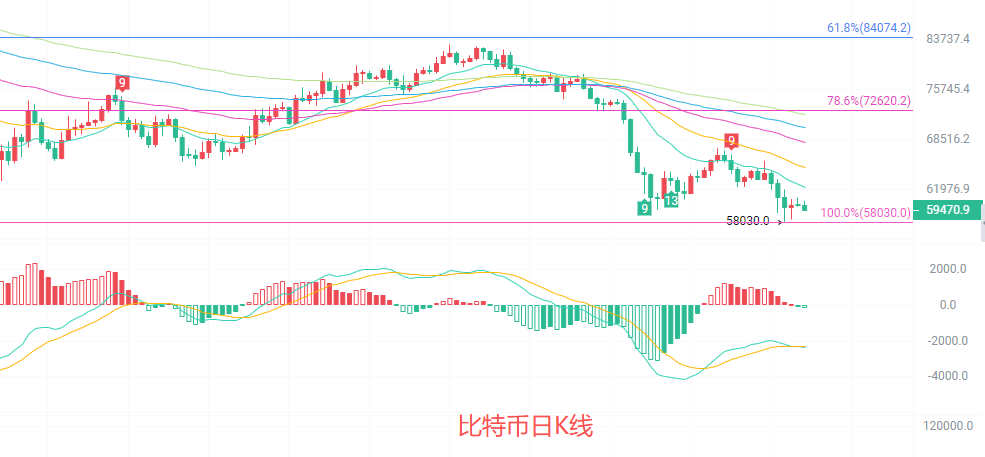
The daily candlestick is currently at a critical North-South negotiation point. The price is firmly suppressed by moving averages such as EMA15 and EMA30, with the Bollinger Bands opening downwards. The upper band around 66900 constitutes strong resistance, and the lower band at 58800 offers short-term support. On the MACD indicator, although the DIF and DEA are still below the zero axis, the green histogram is starting to shorten, indicating signs of exhaustion in the downward momentum. The overall trend remains in a descending channel, and short-term rebounds lean towards weak repairs, with no clear reversal signals. The key upper resistance level is around 62600; if it cannot break through, weakness is likely to continue.
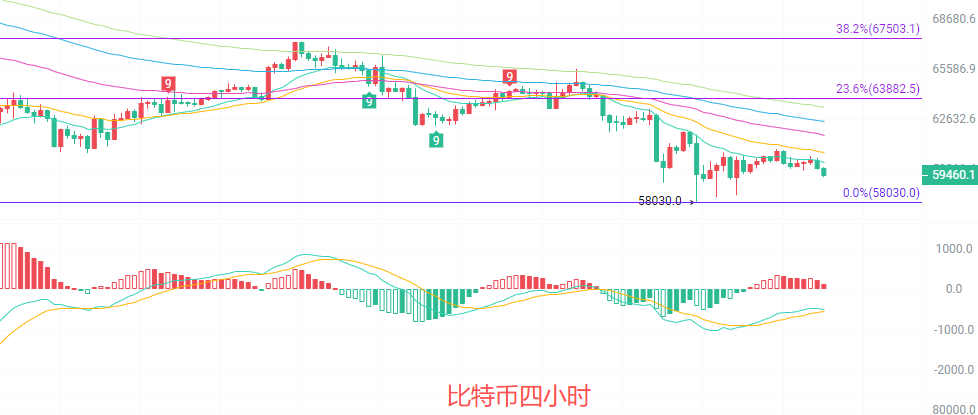
The four-hour candlestick trend is more inclined to narrow fluctuations and a downward trend. The price has always been running below the EMA moving average group, forming a clear descending channel. The Bollinger Bands continue to tighten, and the price is running close to the lower band, with short-term volatility space compressed in the range of 59300 to 60000. The MACD indicator shows that the DIF and DEA form a golden cross below the zero axis, but the increase in the red histogram is insufficient, indicating weak rebound strength. The Fibonacci 0.0% level at 58030 is strong support on the downside, while the 23.6% level at 63880 is the first resistance on the upside. The current price is in a weak consolidation phase, with both bulls and bears waiting for direction choice; low trading volume also indicates that a breakout is imminent.
Short-term reference: The market is never 100%, so always make sure to set stop losses; safety first, small losses with large profits are the goal.
If 58500 to 58000 does not break down, go long, stop loss at 57500, target at 60000 to 61000.
If 60500 to 61000 does not break up, go short, stop loss at 61500, target at 59500 to 58500.
Specific operations should be based on real-time market data. For more information, please consult the author. The article may be published with a delay; it is recommended for reference only, at your own risk.

Friendly reminder: The above content is only created by the author's public account. Ads at the end of the article and in the comments section have no relation to the author; please discern carefully. Thank you for reading.
免责声明:本文章仅代表作者个人观点,不代表本平台的立场和观点。本文章仅供信息分享,不构成对任何人的任何投资建议。用户与作者之间的任何争议,与本平台无关。如网页中刊载的文章或图片涉及侵权,请提供相关的权利证明和身份证明发送邮件到support@aicoin.com,本平台相关工作人员将会进行核查。