The weekend market lacks obvious selling pressure, with main funds more inclined to use time to repair the structure. Yesterday's market rose continuously for nearly 20 hours; after breaking through the 2-hour resistance, it accelerated, but once reaching a high point, the daily chart left an upper shadow, and it retraced again at night. Currently, it has entered the phase of seeking support after a decline.
From a cycle perspective, the adjustments in the 1-hour and 2-hour periods are basically in place, indicating a short-term need for repair; however, the 4-hour cycle has turned bearish, and the 6-hour, 8-hour, and 12-hour cycles are in a neutral state, while the daily chart is still in a bottom area. In other words, the current market has not formed a unified direction, and it is more about oscillating while waiting for a choice.
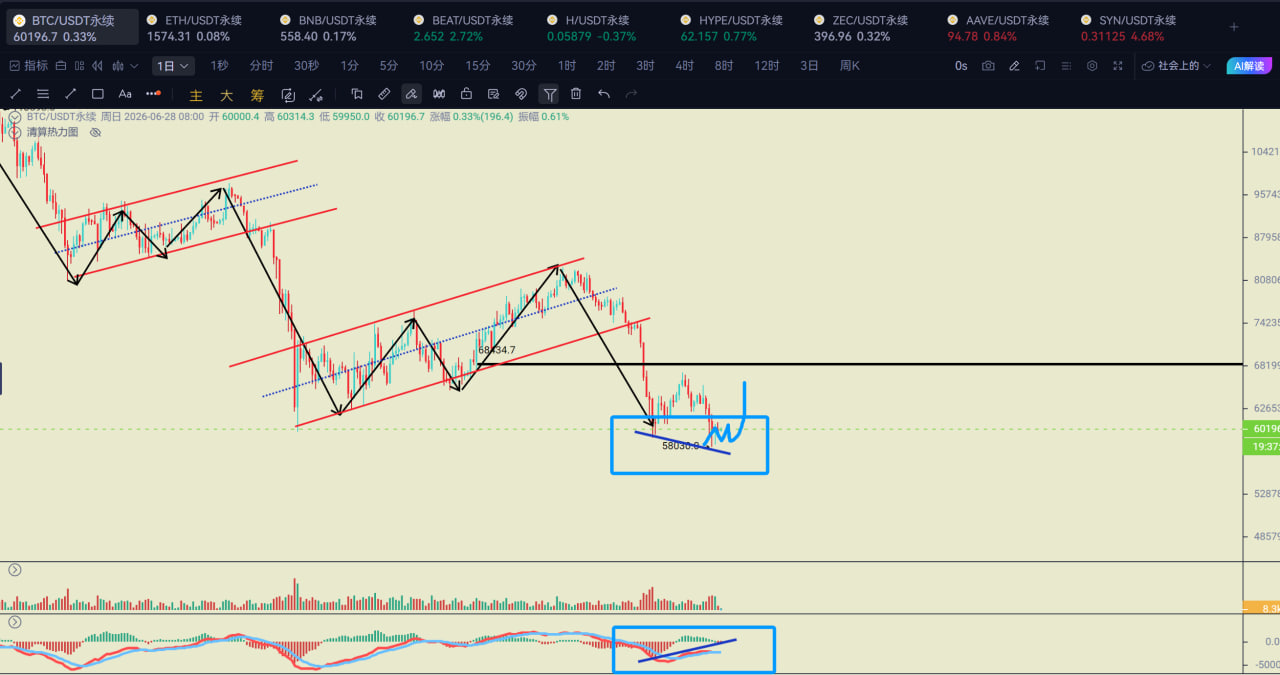
Regarding Bitcoin, the overall trend remains weak. After the price broke below the major moving averages, the moving average system maintained a bearish arrangement, with the mid-band of the 4-hour Bollinger Bands around 60741 constituting short-term resistance. The 1-hour MACD bullish bars are continuously shrinking, with the price repeatedly facing pressure around 60200, indicating that the bullish repair efforts are limited. However, the daily RSI is about 31.8, which is close to the oversold area, suggesting that the space for further downside should also be viewed cautiously.
On-chain and funding conditions are still pessimistic. Currently, about 10.46 million BTC are in a state of floating losses, accounting for more than half of the circulating supply; the net outflow of the U.S. spot Bitcoin ETF over the past 30 days has reached approximately $6.4 billion, setting a record for the largest monthly outflow in history; the fear and greed index is only 18, indicating that the market is still in a state of extreme fear.
Overall, today is more suitable for dealing with oscillation strategies, waiting for a clear direction. If there is a sharp drop during the session, short-term bullish opportunities can be focused on after low-level support; if the rebound cannot break through the resistance, then one should still guard against a further decline.
Support levels to watch: 60000, 59720, 59440, 58577
Resistance levels to watch: 60480, 60888, 61350
Tencent Meeting 24-hour live room: 759-223-4196

This article is originally published by 【Huiying Community】 and represents personal opinions only. Due to certain delays in information transmission, the content is for reference only and does not constitute any investment advice. Please make rational judgments and operate cautiously.
If you need daily more timely market analysis and strategic thinking, feel free to add Safew's contact information, or add three lines: MY89080, to join the group and learn for free.
The community has 15 professional analysts who monitor the market live all day. Here, you can not only learn technical analysis methods in practical situations but also gain a systematic understanding of position relief strategies and risk control systems.
免责声明:本文章仅代表作者个人观点,不代表本平台的立场和观点。本文章仅供信息分享,不构成对任何人的任何投资建议。用户与作者之间的任何争议,与本平台无关。如网页中刊载的文章或图片涉及侵权,请提供相关的权利证明和身份证明发送邮件到support@aicoin.com,本平台相关工作人员将会进行核查。