Good morning, friends. I am Sister Qinglan. This morning, when I opened the market, I saw that the market sentiment was extremely pessimistic. In the focal news, there are two matters that we should pay close attention to. First, the net outflow from the U.S. Bitcoin spot ETF this week is $1.79 billion, which is a signal of large-scale capital escape from institutions, directly suppressing the price of Bitcoin. Second, the Coinbase Bitcoin negative premium has continued for 40 days, indicating that purchasing power in the U.S. market remains sluggish, with heavy selling pressure. These two pieces of information combined tell us that the current market lacks incremental funds, making a short-term rebound very difficult.
Current Price and Time
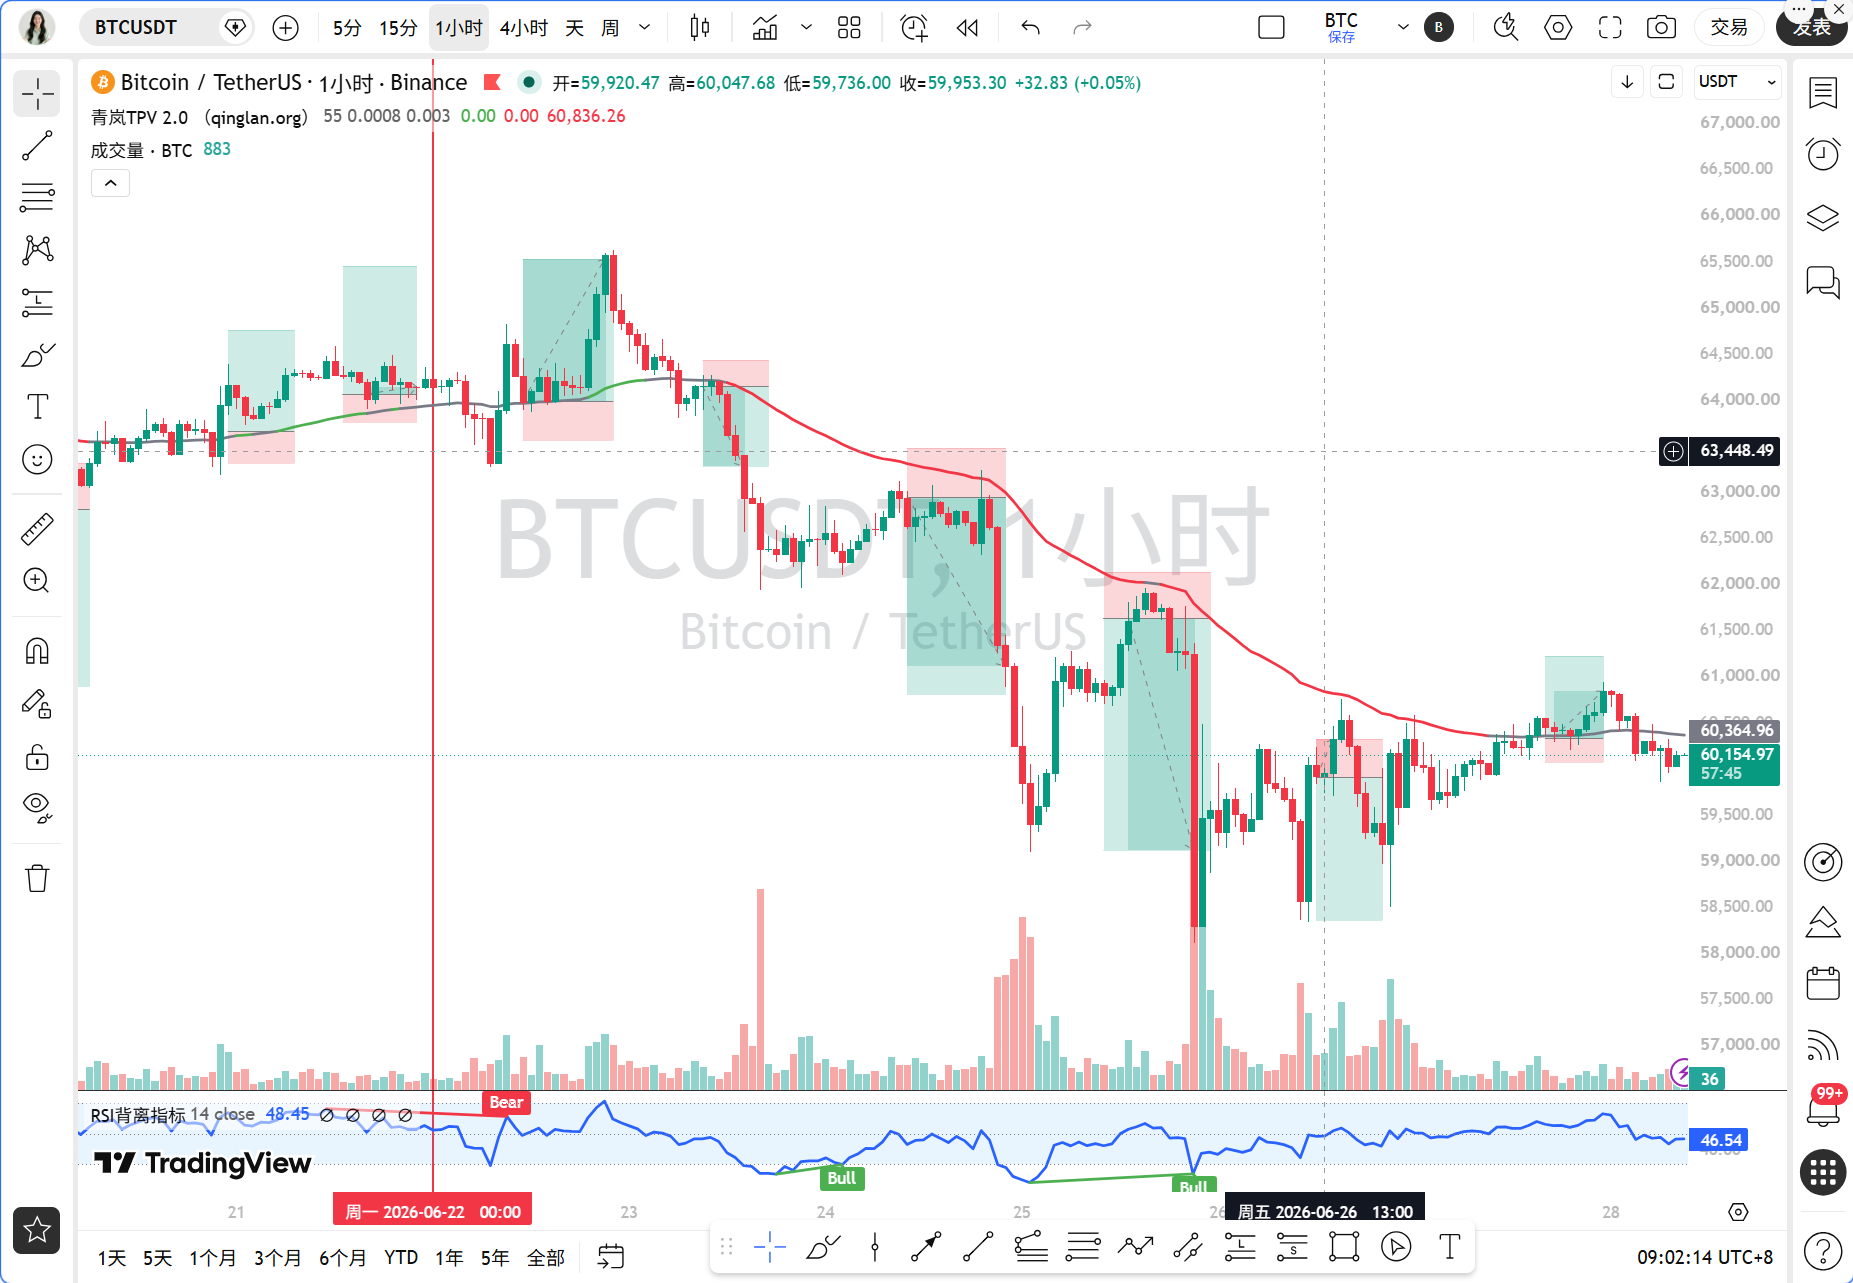
The current time is June 28, 09:02, with the Bitcoin quote at 60164 USDT. This price is in a very sensitive position, as it has neither fallen below the 60,000 mark nor formed an effective rebound, with both bulls and bears waiting to see.
Multi-Cycle Status Overview
Let’s first look at the daily chart. On the daily level, MA5 is 60232, MA10 is 61907, and MA30 is 64043, indicating a bearish arrangement in the moving average system. The MACD's DIF is -2314.75, DEA is -2308.66, and the histogram is -6.08. Although the green bars are shortening, the overall remains below the zero axis. RSI is 26.18, which has entered the oversold region. Overall, the daily chart shows a bearish trend, but the oversold condition may trigger a technical rebound.
On the 4-hour level, MA5 is 60314, MA10 is 60260, and MA30 is 60931, with the price entangled around MA5 and MA10. The MACD's DIF is -535.48, DEA is -669.18, and the histogram is 133.70, with the red bars increasing, indicating a weakening of bearish momentum. RSI is 56.78, in a neutral and slightly weak area. The 4-hour level shows signs of stabilization, but there is no clear reversal signal yet.
On the 1-hour level, MA5 is 60154, MA10 is 60315, and MA30 is 60301, with the price operating below the moving averages. The MACD's DIF is -1.81, DEA is 63.96, and the histogram is -65.78, with green bars shortening, indicating a decline in bearish momentum. RSI is 44.49, in a weak area. EMA55 is 60197.97, with the current price of 60164 slightly below EMA55, but very close.
On the 15-minute level, MA5 is 60158, MA10 is 60113, and MA30 is 60265, with the price above MA5 and MA10 but under pressure from MA30. The MACD's DIF is -77.26, DEA is -92.81, and the histogram is 15.56, with red bars appearing and showing signs of a short-term rebound. RSI is 44.45, in a neutral and slightly weak area.
TPV Signal Validation
According to the Qinglan TPV system, let's first check the trend positioning. The current 1-hour EMA55 is 60197.97, and the current price of 60164 is below EMA55, so the system determines it is in a bearish trend zone. However, we need to further validate whether the short-selling conditions are met.
First short-selling condition: the price must be pressured below the 1-hour EMA55, with two consecutive 1-hour candle closing prices below EMA55. We check the last two 1-hour candles, which closed at 60154 and 60164, both below 60197.97, so the condition is met.
Second short-selling condition: there must be pressure resistance, indicated by a long upper shadow, top divergence, or touching an effective high point before retracing. In the past few candles, the price near 60300 shows significant upper shadows and has touched the pressure points at 1-hour MA10 and MA30, then retreating, so the condition is met.
Third short-selling condition: the rebound must be weak, requiring the MACD bars to shorten consecutively for 2 periods or the RSI to drop from above 70. Currently, the 1-hour MACD histogram is -65.78, the previous period was -78.12, and the one before that was -92.45, with the green bars shortening continuously, indicating a decline in bearish momentum, but this is a rebound signal, not a short-selling signal. Also, RSI is 44.49, far below 70, not satisfying the condition of falling from a high position. Therefore, the third short-selling condition is not met.
Next, we check the rules for handling choppy markets. In the last 8 1-hour candles, the closing prices above EMA55 occurred 4 times, with 3 crossovers, and the current price's absolute distance from EMA55 is 0.06%, less than 0.3%. According to the rules, this is considered a choppy market, so we do not actively go long or short, only providing the range.
Thus, the current conclusion of the TPV system is: choppy market, wait for a breakout confirmation.
On-chain Capital Situation
In terms of on-chain data, the Fear and Greed Index is 18, indicating extreme fear, a signal of extremely pessimistic market sentiment. The BTC 24-hour fluctuation is 0.23%, essentially flat, indicating a temporary balance between bullish and bearish forces. BTC market share is 55.83%, at a high level, indicating that funds are still seeking refuge in Bitcoin, but the liquidity of altcoins is poorer.
On the capital side, the U.S. Bitcoin spot ETF has seen a net outflow of $1.79 billion this week, and Coinbase has been in a negative premium for 40 days, all of which are very unfavorable signals. Institutional capital continues to flow out, retail purchasing power is weak, and the market lacks upward driving force. Meanwhile, geopolitical risks have intensified, the situation between the U.S. and Iran has escalated, and risk aversion has heightened, leading to short-term capital potentially flowing out of the crypto market towards traditional safe-haven assets like gold or USD.
Key Resistance and Support Levels
The most important support level currently is the psychological level of 60000, which is also a key position on the daily level. If it falls below 60000, the next support level is around 58000, which is in the previous low point area. The initial pressure level above is 60300, which is the resonance pressure level of 1-hour MA10 and MA30. If 60300 is broken, the next pressure level is at 61000, the position of 4-hour MA30. Further above, the pressure level is at 62000, which is the position of the daily MA10.
Trading Ideas
Since the current TPV system determines it is a choppy market, we do not recommend actively going long or short, but rather wait for a breakout confirmation before entering.
Direction: Wait for breakout confirmation. If the price effectively breaks through 60300 and stabilizes, consider going long. If the price falls below 60000 and confirms, consider going short.
Entry Conditions: For going long, the price needs to break through 60300, then pull back without breaking 60300, and the 1-hour candle closing price must be above EMA55, with the MACD histogram turning from green to red. For going short, the price needs to fall below 60000, then rebound without breaking 60000, and the 1-hour candle closing price must be below EMA55, with the MACD histogram turning from red to green.
Stop-loss Levels: For going long, set the stop-loss at 59800, and stop loss if it falls below 60000. For going short, set the stop-loss at 60500, and stop loss if it breaks 60300.
Target Levels: For going long, first target is 61000 and second target is 62000. For going short, first target is 59000 and second target is 58000.
Risk Warning
The current market is in a state of extreme fear, with insufficient liquidity, and volatility may increase. Please strictly control your position and avoid heavy operations.
Follow Qinglan Crypto Classroom to capture more trading opportunities! Welcome to visit the official website www.qinglan.org
📊 Qinglan TPV Trading Strategy Backtest Reference
🕒 Last Backtest Time 06-28 07:00:02
Total Analysis: 2559 Backtests: 1966 Accuracy Rate: 72.3% (1421/1966)
免责声明:本文章仅代表作者个人观点,不代表本平台的立场和观点。本文章仅供信息分享,不构成对任何人的任何投资建议。用户与作者之间的任何争议,与本平台无关。如网页中刊载的文章或图片涉及侵权,请提供相关的权利证明和身份证明发送邮件到support@aicoin.com,本平台相关工作人员将会进行核查。