Market Waves: 6.27 Ethereum (ETH) Market Analysis Reference:
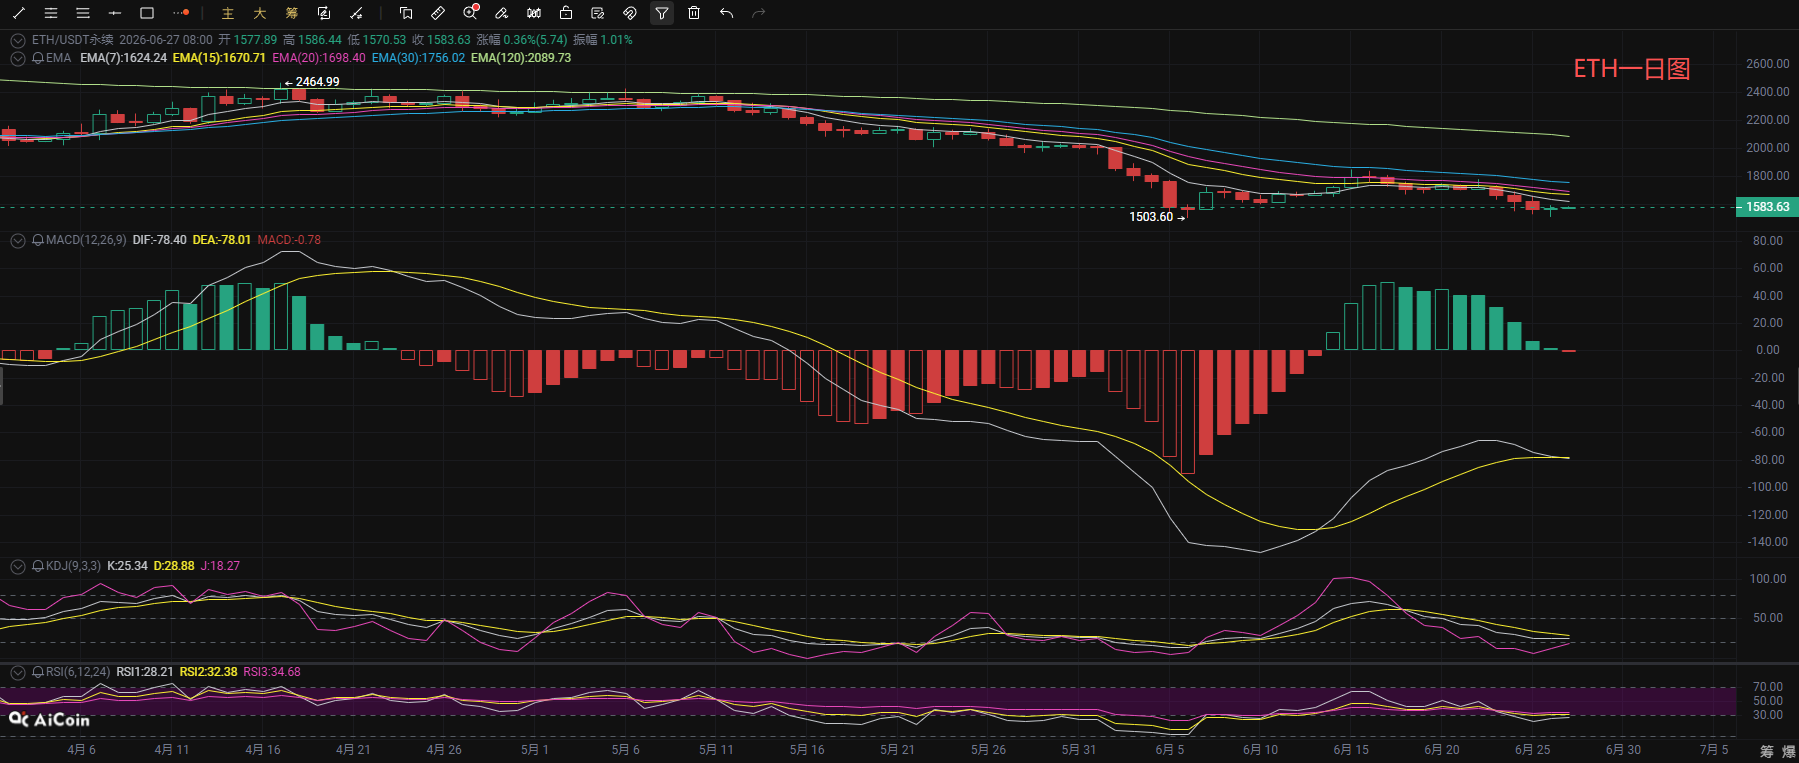
Ethereum has rebounded after a low-point decline, and intra-day trading continues to show a narrow oscillation trend. On the daily level, it remains in a weak bottom area after a decline, the Bollinger Bands are trending downward, with the price continuously under pressure at the middle band line of 1681. The moving averages of all cycles are arranged in a bearish manner from top to bottom, creating ongoing suppression. The bullish momentum of the MACD is continually weakening; although the current downward momentum has slowed, the dual lines are still below the zero axis, and a death cross is emerging. KDJ and RSI are in the weak zone, lacking the sustained momentum to strengthen upwards. The overall bearish structure on the daily chart has not changed; the market is primarily consolidating at low levels. Key support below is at 1503. If it cannot increase the volume to stay above the middle band at 1681, there is still the possibility of further decline.
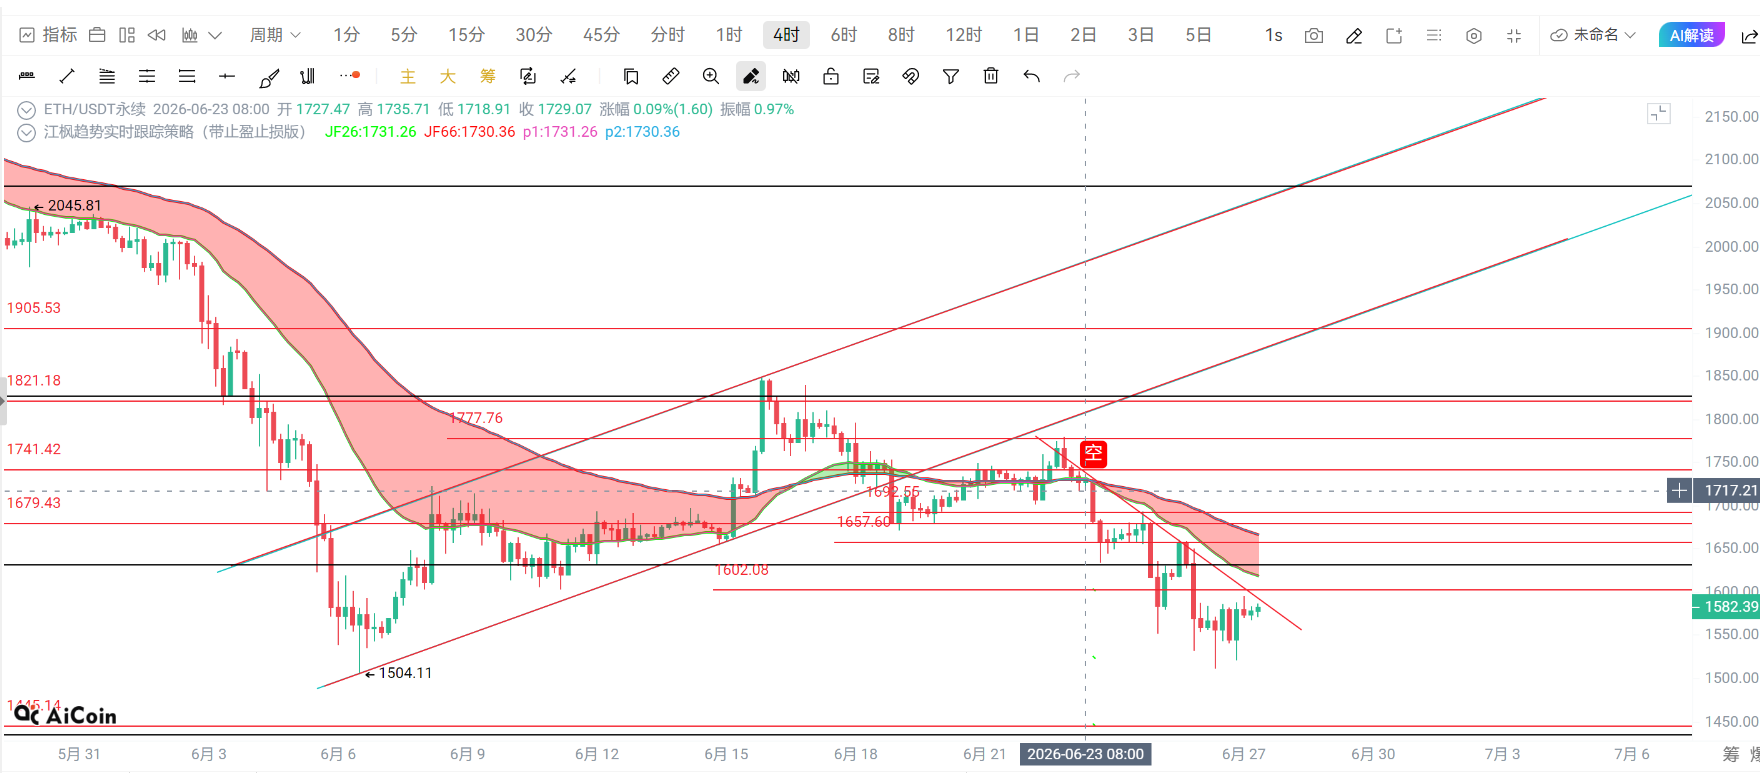
The short-cycle 4-hour chart shows a round of oversold recovery trading, with the Bollinger Bands contracting and the price operating in the middle to lower band area. The MACD forms a golden cross below the zero axis, indicating a release of short-term bullish strength; however, the J value of the KDJ indicator has touched the overbought area, suggesting a possible short-term pullback to digest the pressure. The distance between short-term moving averages is narrowing, with the 30-day moving average at 1620 forming direct pressure, and the upper Bollinger band at 1672 serving as strong resistance. The short-term probability is likely to maintain a narrow oscillation and consolidation pattern. Only by effectively stabilizing above the middle band of Bollinger can the space for this round of rebound continue to open upward.
Market Waves: 6.27 Ethereum Short-term Reference:
Shorts: Enter short in the range of 1650-1620, stop loss above 1685, target at 1600-1550,
Longs: Enter long in the range of 1520-1550, stop loss below 1485, target at 1570-1620,
[The above analysis and strategies are for reference only. Please bear the risks yourself; the article publication may have delays, and the strategies may lack timeliness. Do not operate blindly.]

The content of this article is originally shared by [Market Waves], representing personal views only. There may be delays in sending articles; for reference only, do not operate blindly! Want to get more real-time signals daily? Then follow my public account! Here, you can engage in online technical learning and also understand knowledge related to getting out of positions. I have many years of research experience in the market and focus on the major trends in the cryptocurrency sector. Primarily responsible for analyzing and guiding investment operations for BTC, ETH, SOL, BCH, and other coins. Welcome to study and learn together.
免责声明:本文章仅代表作者个人观点,不代表本平台的立场和观点。本文章仅供信息分享,不构成对任何人的任何投资建议。用户与作者之间的任何争议,与本平台无关。如网页中刊载的文章或图片涉及侵权,请提供相关的权利证明和身份证明发送邮件到support@aicoin.com,本平台相关工作人员将会进行核查。