Dear friends, I am Sister Qinglan. Today, the market is very lively with significant breakthroughs in the AI field and macro-level pressures. In the key news, I will highlight two crucial points: first, OpenAI released a preview of GPT-5.6, which includes three models: Sol, Terra, and Luna, directly boosting technology stock sentiment and indirectly benefiting the crypto market; second, Federal Reserve officials have signaled that nearly half predict at least one more rate hike this year, which poses a pressure on risk assets. With one bullish and one bearish factor intertwined, the market is seeking direction amidst hesitation. Our analysis today will peel away the fog from these data.
Current Price and Time
The current time is June 27th, 10:53, and BTC is priced at 60344 USDT. The 24-hour increase is 3.06%, but the fear-greed index is only 15, indicating extreme fear and suggesting market sentiment remains weak. BTC's market share is 55.64%, showing that funds are still seeking refuge in Bitcoin, but the selling pressure on-chain and macro pressure have not dissipated.
Multi-Cycle Status Overview
First, let's look at the daily level. BTC’s daily closing price is 60344, below MA5’s 60809 and MA10’s 62217, much lower than MA30’s 64497. The MACD death cross status continues, with DIF at -2299, DEA at -2298, and the histogram at -0.99; although bearish momentum is weak, it has not turned positive. The RSI is 34.24, close to the oversold area but has not formed an effective rebound signal. The daily overall is in a descending channel with limited rebound strength.
At the 4-hour level. MA5 and MA10 are blended around 59986 and 59917, but MA30 at 61737 forms strong resistance. The MACD shows DIF at -811, DEA at -878, and the histogram at 66.43, indicating bearish momentum is waning, but the price is still below MA30. The RSI is at 52.06, in a neutral and slightly weak area. The 4-hour shows signs of stabilization but has not broken through key resistance.
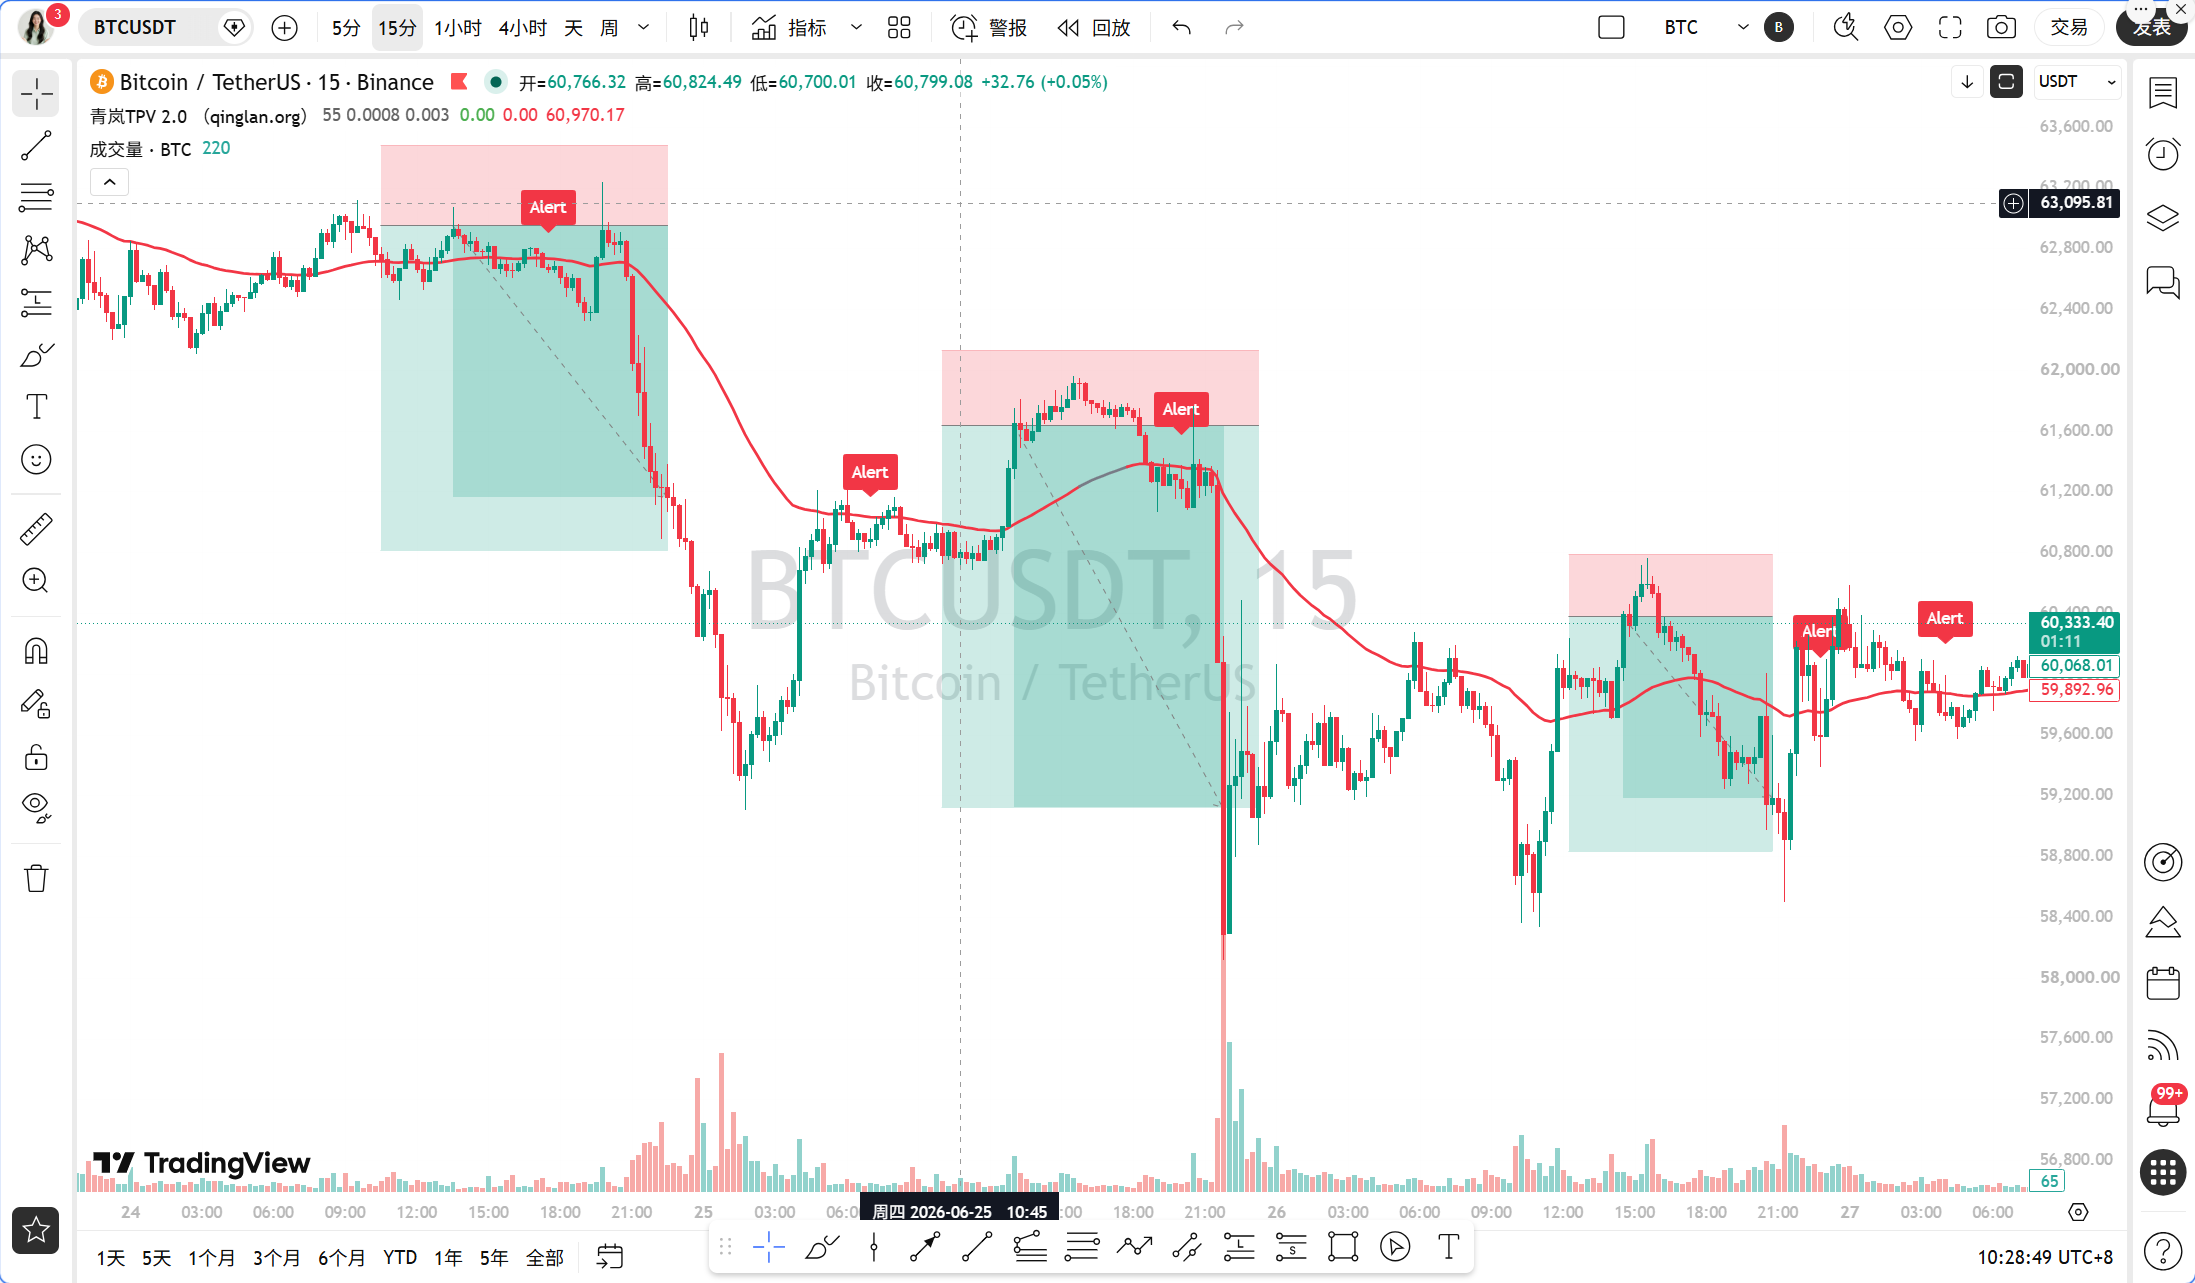
At the 1-hour level. MA5 is 60098, MA10 is 59957, and MA30 is 59862; the moving average system is starting to diverge upwards. The MACD shows DIF at 14.62, DEA at -52.76, and the histogram at 67.39, with bullish momentum continuously strengthening. The RSI is 64.41, close to the overbought area but not overheated. The key point is that EMA55 is currently at 60293.75, and the price of 60344 just stands above this, marking a short-term dividing line between bulls and bears.
At the 15-minute level. MA5 is 60196, MA10 is 60095, and MA30 is 59976, with short-term moving averages in a bullish arrangement. The MACD shows DIF at 80.91, DEA at 49.18, and the histogram at 31.73, with bullish momentum still present but slightly slowing. The RSI is at 69.12, near overbought, indicating a short-term need for a pullback.
TPV Signal Validation
Now let’s verify the signal using the Qinglan TPV system. First, looking at trend positioning. The current price is 60344, with the 1-hour EMA55 at 60293.75. Since the price is above EMA55, we are currently in a bullish trend area. However, note that the oscillation auxiliary data shows that, among the last 8 1-hour K-lines, the closing price was greater than EMA55 only once, and there was one crossover; the price is at a mere 0.08% away from EMA55, indicating a tight line fluctuation. Although it does not meet the oscillation threshold, the tight line status increases the probability of oscillation, necessitating caution against false breakouts.
Validation of Long Conditions. First, the price must stabilize above the 1H EMA55. Currently, the price of 60344 is above EMA55 of 60293.75, but it requires two consecutive 1-hour closing prices above EMA55. The most recent closing price is 60344, with the previous at 60280, slightly below EMA55, so the condition is not yet fully met. Second, support stabilizes. Both the 15-minute and 1-hour levels have long lower shadows, bouncing back after reaching around 59800, forming a bottom division structure, indicating valid support. Third, bearish momentum exhausts. The 1-hour MACD histogram has shortened for two consecutive periods since the June 26 low, with the histogram turning from negative to positive and continuing to expand, but the last two histogram values are 65 and 67, still increasing without showing a continuous shrink. Thus, in the conditions for longing, the first and third are not fully confirmed.
Validation of Short Conditions. First, the price faces resistance below the 1H EMA55. The current price is above EMA55, which does not meet the condition. Second, pressure meets resistance. There was a long upper shadow around 60500 at the 1-hour level, but no top division formed. Third, the rebound is weak. The 1-hour RSI dropped from 64.41, but the MACD histogram is still increasing, which does not satisfy the conditions. So, the short conditions are also not established.
In summary, we are currently in a mildly bullish state of oscillation, but tight line fluctuations increase uncertainty. According to the TPV system, in oscillating markets, we do not actively long or short, only provide ranges. The upper range focuses on 60500-60800, and the lower range focuses on 59800-59500.
On-Chain/Fundamentals
In terms of on-chain data, the fear-greed index is 15, indicating extreme fear. Historically, such a position often corresponds to a phase bottom, but time is needed for digestion. BTC’s 24-hour increase of 3.06% is noted, but the market share of 55.64% shows funds are still seeking refuge in Bitcoin, while altcoins are seeing outflows. In key news, SharpLink Gaming purchased 10,000 ETH in two days, valued at 15.73 million USD, signaling large institutional buying and providing support for ETH. On the other hand, four wallets have sold nearly 38,000 ETH, cashing out 58.69 million USDS, indicating large holders are offloading. The mixed bullish and bearish signs show inconsistent on-chain funding conditions.
Macro Perspective: Expectations of Federal Reserve rate hikes and escalating trade frictions are significant bearish factors, while AI benefits and easing Middle East tensions provide some hedges. Overall, the market is in a news-driven oscillation pattern lacking a clear direction.
Key Attack and Defense Points
The key resistance above is at 60500, which is the pressure zone of the previous 1-hour high and the MA30 of the 4-hour. If it breaks through 60500 and stabilizes, the next target is 60800-61000, which corresponds to the MA5 of the daily and the previous dense trading area. The key support below is at 59800, which is the area of the 1-hour EMA55 and the 15-minute low point. If it breaks below 59800, the next support watches 59500, which is the previous 4-hour low and daily support. In extreme cases, if panic worsens, it could test 59000, which is a recent low mentioned in the focus news.
Trading Ideas
Based on the TPV system, we are currently in a tight line fluctuation state, increasing the probability of oscillation, so do not actively chase long or short; rather, focus on range trading.
Direction: Range oscillation, buy high sell low.
Entry Conditions:
Long: Price pulls back to the area of 59800-59500, forming a long lower shadow or bottom division structure, and the 1-hour MACD histogram has shortened for two consecutive periods, with the RSI rebounding from around 30. Entry point reference is 59700-59800.
Short: Price rebounds to the area of 60500-60800, forming a long upper shadow or top division structure, and the 1-hour MACD histogram has shortened for two consecutive periods, with the RSI dropping from around 70. Entry point reference is 60600-60700.
Stop Loss Position:
For longs, set a stop loss at 59300; if it breaks below, the bullish position fails.
For shorts, set a stop loss at 61000; if it breaks above, the bearish position fails.
Target Position:
For longs, the first target is 60500, and the second target is 60800.
For shorts, the first target is 59800, and the second target is 59500.
If the price breaks through 60800 and stabilizes, consider lightly chasing long with a target of 61500-62000, setting a stop loss below 60500. If the price breaks below 59500, consider lightly chasing short with a target of 59000-58500, setting a stop loss above 59800.
Risk Warning
Currently, in a tight line fluctuation and extreme fear sentiment, the risk of false breakouts is high; be sure to control the position and strictly implement stop losses.
Follow Qinglan Crypto Classroom to grasp more trading opportunities! Welcome to visit the official website www.qinglan.org
📊 Qinglan TPV Trading Strategy Backtest Reference
🕒 Last Backtest Time 06-27 07:00:02
Total Analysis: 2536 Backtest: 1953 Accuracy Rate: 72.1% (1408/1953)
免责声明:本文章仅代表作者个人观点,不代表本平台的立场和观点。本文章仅供信息分享,不构成对任何人的任何投资建议。用户与作者之间的任何争议,与本平台无关。如网页中刊载的文章或图片涉及侵权,请提供相关的权利证明和身份证明发送邮件到support@aicoin.com,本平台相关工作人员将会进行核查。