Crypto Circle Academician: Where is the real stabilization signal for 6.25 Bitcoin (BTC)? Latest market analysis
The current price of Bitcoin is 59400, which has directly confused the market! It has dropped from 60,000 all the way to 59800. Who wouldn’t be anxious seeing this decline? Many people who just bought the dip have been trapped, long positions are being pressed down, and short positions are also afraid of getting caught in a rebound trap. Now the entire crypto circle is asking where the bottom is? Don’t panic! Today, I will clarify the current support, resistance, and long-short signals for you, without any fluff, just actionable strategies. After reading, you'll know how to respond next!
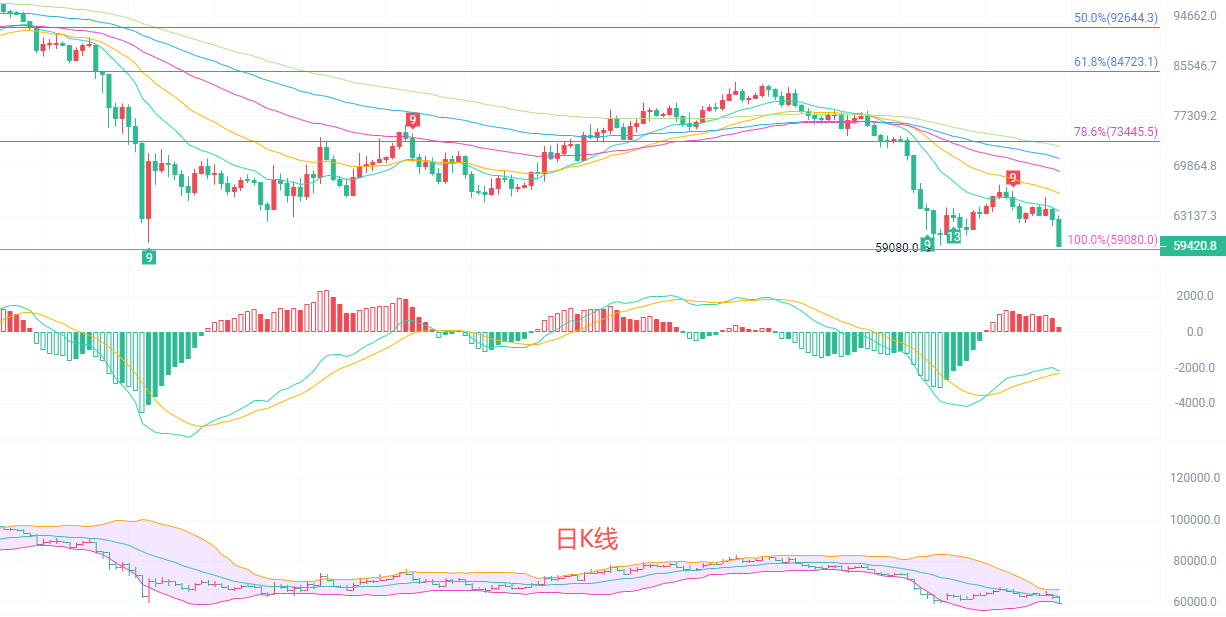
The daily K-line has directly broken below the previous low support and is fully above the Fibonacci 100% extension level of 59080. The current price has dropped below all EMA moving average systems, with the 15-day, 30-day, and 60-day moving averages all showing a downward arrangement, with strong resistance above. The MACD indicator's green bars continue to expand, and the DIF and DEA have continuously declined after crossing below the zero axis, with downward momentum still being released; the Bollinger Bands' opening continues to expand, the price has dropped below the lower track, showing short-term oversold conditions but no obvious stabilization signals, with the overall trend completely leaning towards bearish.
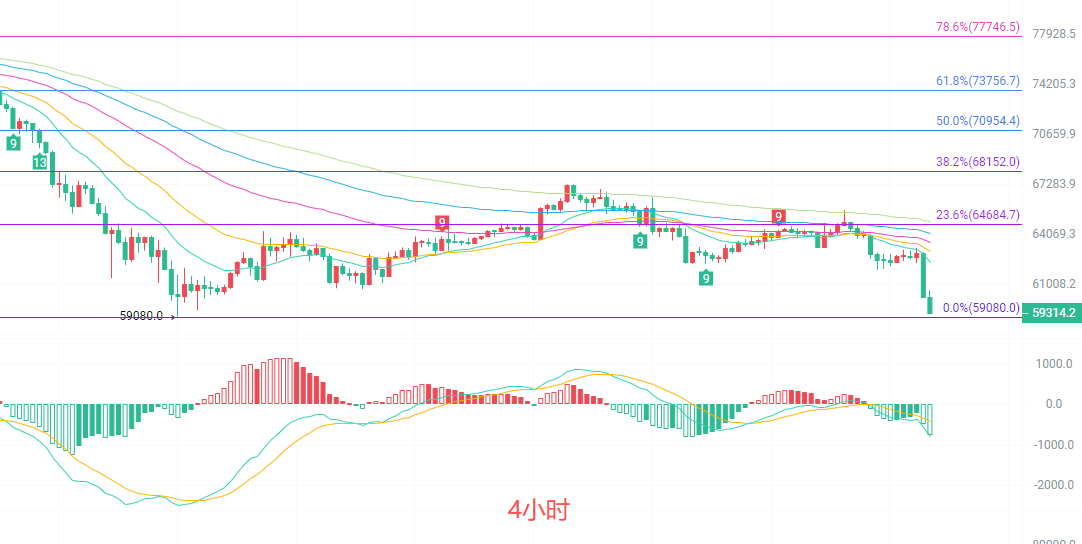
The four-hour K-line has broken below the previous fluctuation range again, with the current level around 59800 being a recent low point. The lower track of the Bollinger Bands near 59537 provides slight support. The moving average system shows a typical bearish arrangement, with EMA15, 30, and 60 all turning downwards. The price encounters resistance and falls back when it rebounds to around EMA15, forming a clear pressure point. The MACD bearish dominance pattern remains unchanged; the Fibonacci 0.0% support level of 59080 is a key defensive line. Once broken, the downward space will completely open up, and any short-term rebound is only seen as a weak correction.
Short-term Reference: The market is not 100%, so always set stop losses; safety first, small losses and big profits are the goal.
If the area from 59000 to 58500 holds, aim for upward movement; stop loss at 58000, target at 60000 to 61000.
If the area from 61500 to 62000 holds, aim for downward movement; stop loss at 62500, target at 60500 to 59500.
Specific operations should be based on real-time market data. For more information, you can consult the author. There may be delays in article publication; suggestions are for reference only, and risks are undertaken by yourself.
免责声明:本文章仅代表作者个人观点,不代表本平台的立场和观点。本文章仅供信息分享,不构成对任何人的任何投资建议。用户与作者之间的任何争议,与本平台无关。如网页中刊载的文章或图片涉及侵权,请提供相关的权利证明和身份证明发送邮件到support@aicoin.com,本平台相关工作人员将会进行核查。