Dear friends, I am Qinglan. Early this morning, the crypto market experienced a bloodbath, with liquidations reaching as high as $650 million in 24 hours, severely impacting long positions. Meanwhile, the AI sector in U.S. stocks faced a black Tuesday, with Micron and SanDisk plummeting over 13%, risk sentiment is transferring from traditional markets to the crypto realm. The VIX panic index rose over 14% during the day, and market risk aversion escalated sharply. These two pieces of news combined directly suppressed BTC's rebound momentum, and the short-term outlook is not optimistic.
Current Price and Time
The current time is June 24, 10:43, and the latest BTC quote is 62726 USDT, with a 24-hour decline of 2.24%. The Fear and Greed Index stands at only 17, in the extreme fear zone, and market sentiment is nearing freezing point. This position marks the continuation of panic, but it may also be a brewing opportunity, depending on how we interpret the data.
Multi-Cycle Status Overview
First, looking at the daily level, the MA5 and MA10 moving averages have crossed bearishly downward, with the price under pressure below the MA5 at 63418. Although the MACD histogram is positive, the DIF and DEA remain in the deep water area below the zero axis, and the overall bearish pattern has not changed. The RSI is at 54.82, in a slightly weak neutral zone, with no obvious oversold signals.
Switching to a 4-hour cycle, the MA5, MA10, and MA30 moving averages are all arranged in a bearish manner, with the price struggling around 62568. The MACD histogram shows a negative value of -161.68, with the DIF and DEA continuing to decline, and bearish momentum is still being released. The RSI is at 36.06, close to the oversold area but has not fallen below 30, indicating that there is still room for decline.
The 1-hour cycle is today's focus. The MA5 and MA10 are entangled around 62799 and 62605, with the price oscillating between the moving averages. Although the MACD histogram is positive at 112.73, the DIF and DEA are still in the negative area, indicating limited rebound strength. The RSI is at 63.74, in a slightly strong neutral position but has not broken through the strong area of 70.
The 15-minute cycle shows increased short-term volatility, with the MACD histogram in negative territory, the DIF crossing below the DEA, and the RSI around 59.81, indicating intense competition between bulls and bears, but the bears have a slight advantage.
TPV Signal Verification
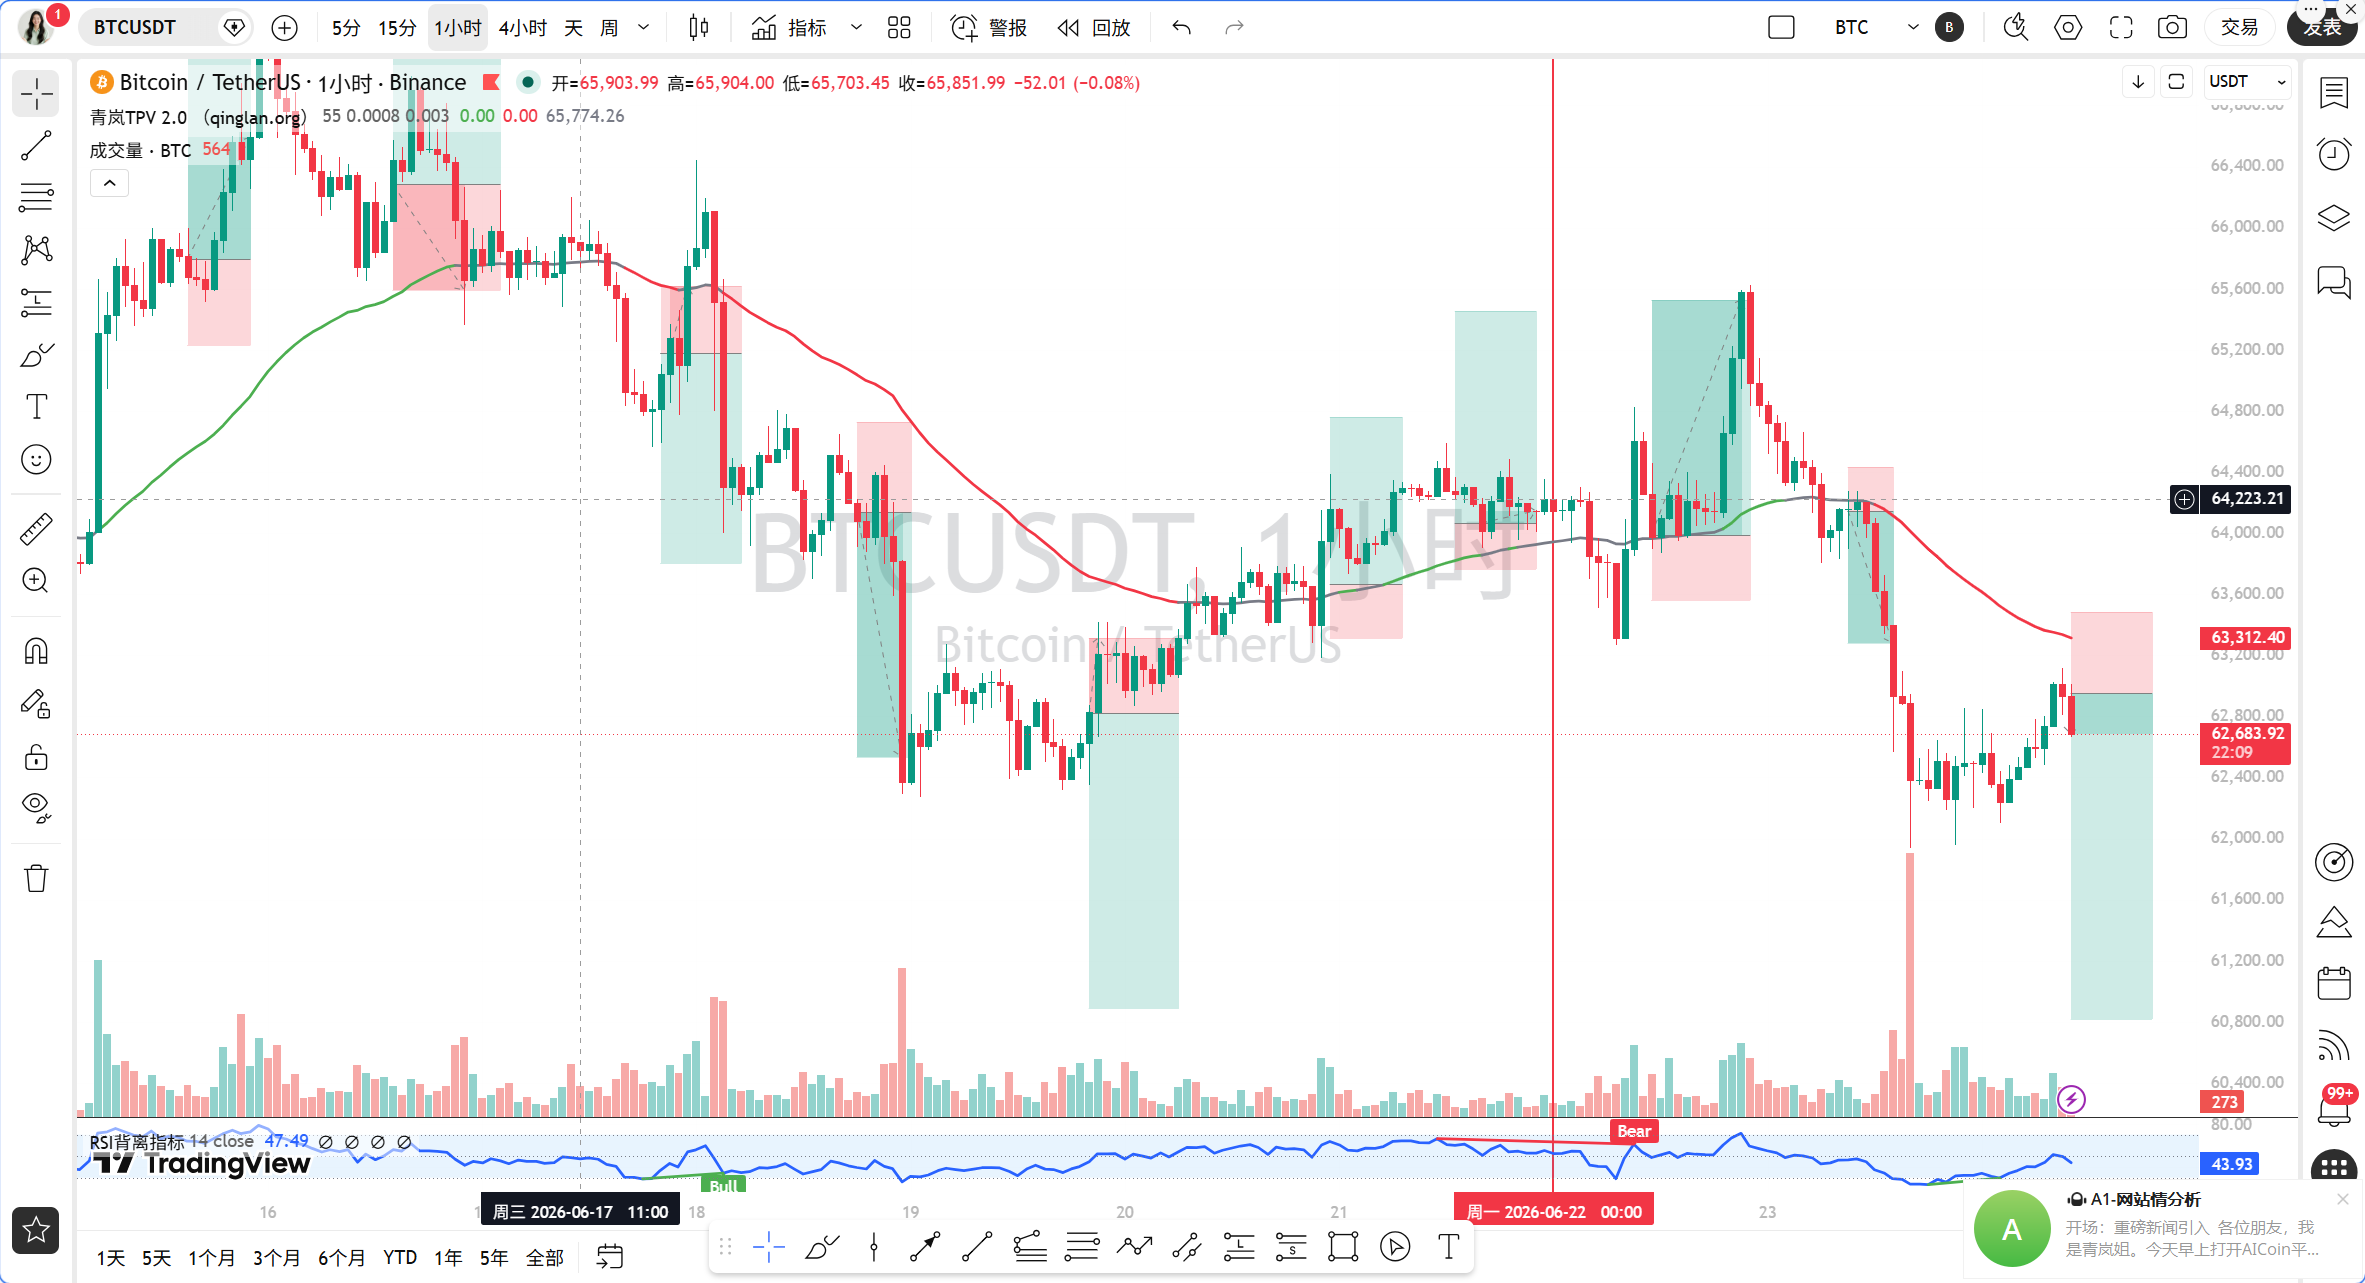
Based on the Qinglan TPV system, we use the 1-hour EMA55 as the boundary between long and short positions. The current EMA55 value is 63330.74, while the BTC price is at 62726, clearly below the EMA55. In the past 8 1-hour K-lines, the number of closing prices greater than EMA55 is 0, and the number of crosses is also 0, with the price being 0.95% away from EMA55, not meeting the oscillation threshold, leading the system to determine a one-sided bearish trend.
As for the conditions for shorting, first, the price is under pressure below the 1-hour EMA55, with two consecutive 1-hour K-line closing prices both below EMA55, thus meeting the first condition. Second, regarding resistance, there was a long upper shadow when the price rebounded to around 63300, followed by a quick drop, forming a top formation, thereby meeting the second condition. Third, the weakness of the rebound is evident, where the MACD histogram is positive in the 1-hour cycle but shows signs of contraction for two consecutive periods, with the RSI falling from 63.74, indicating exhaustion of rebound momentum, thus meeting the third condition. Overall, the TPV system issues a clear bearish signal.
On-Chain/Funding View
On-chain data shows a Fear and Greed Index of 17, indicating extreme fear. Historically, this position often corresponds to a short-term bottom or an acceleration of the drop. However, combined with liquidation data, the $650 million of long positions has been liquidated, and the market leverage has significantly decreased, releasing some selling pressure. On the funding side, Circle issued an additional 250 million USDC on the Solana network, increasing liquidity, although its short-term impact on price is limited. a16z withdrew 25,000 ETH from Binance, showing institutional long-term confidence in ETH, but similar positives are lacking for BTC. The probability of a rate hike by the Federal Reserve in July has risen to 34.2%, with macro pressures still present.
Key Attack and Defense Levels
The first resistance level above is around the 1-hour EMA55 at 63330, which is the lifeline of the bearish trend. If the price cannot stabilize at this level, any rebounds would be a trap for bulls. The second resistance level is near the 4-hour MA10 at 63312, which resonates with the EMA55 for added pressure. The first support level below is near the 4-hour MA5 at 62568, which is a short-term bullish defense point. If this level breaks, the second support level looks at the round number of 62000, which is a previous low area and also a psychological support. Further below, 61500 is the key support at the daily level.
Trading Thoughts
Direction is clear, bearish trend, short in line with the trend.
Entry conditions: wait for the price to rebound to the area near 1-hour EMA55, that is, around 63200-63300, then look for a 15-minute level long upper shadow or top formation while the MACD histogram in the 1-hour cycle shortens again to enter a short position. If the price directly breaks below the 62568 support, consider adding to the short, but be careful with stop losses.
Set the stop loss above 63500, that is, if it breaks through EMA55 and stabilizes, the bearish logic fails. Target levels are first 62000, then 61500. If there is significant volume stagnation or bottom formation near 62000, consider partial profit taking.
Risk Warning
The current market is highly volatile with high liquidation risks, please strictly control your position, with single trade risk not exceeding 2% of total funds.
Follow Qinglan Crypto Classroom for more trading opportunities! Visit the official website www.qinglan.org
📊 Qinglan TPV Trading Strategy Backtesting Reference
🕒 Last Backtest Time 06-24 07:00:02
Total Analysis: 2464 Backtests: 1894 Accuracy: 71.6% (1356/1894)
免责声明:本文章仅代表作者个人观点,不代表本平台的立场和观点。本文章仅供信息分享,不构成对任何人的任何投资建议。用户与作者之间的任何争议,与本平台无关。如网页中刊载的文章或图片涉及侵权,请提供相关的权利证明和身份证明发送邮件到support@aicoin.com,本平台相关工作人员将会进行核查。