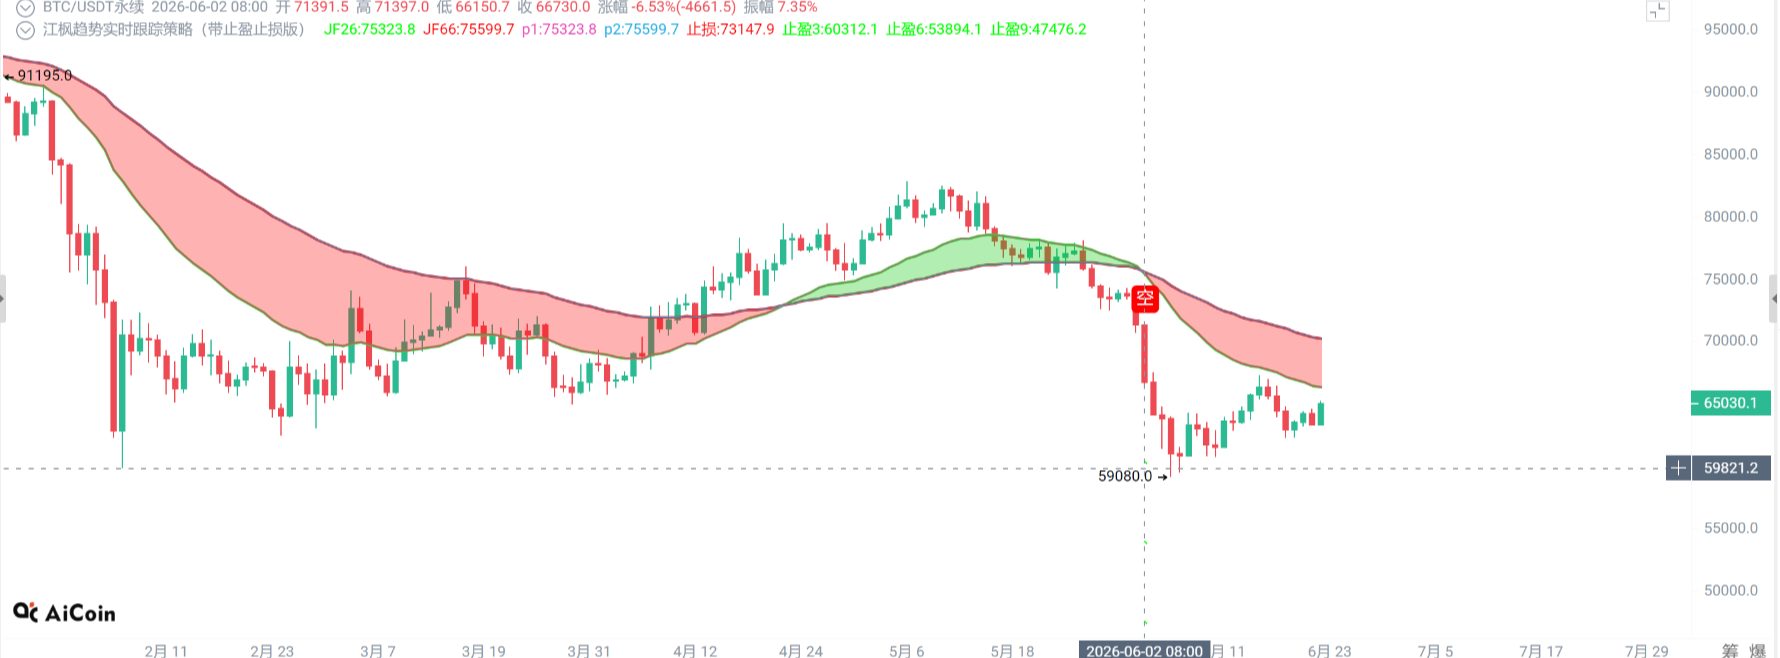
Bitcoin fell into a state of silence this morning. After the impact of the hawkish debut of Fed Chairman Powell last week, Bitcoin has been declining since reaching a high of $67,203 on June 16, and has been trading around $64,000 over the weekend without any rebound momentum. As of the time of writing, Bitcoin is quoted at about $64,100, down 0.45% in 24 hours, with a low of $63,270 at one point during the day. Ethereum has weakened in tandem, quoted at $1,748 at the time of writing, with a 24-hour decline of about 0.36%. Under the "hawkish shadow," market buying pressure is nearly frozen.
The core pressure of this wave of sluggishness comes from the FOMC meeting on June 17. New Fed Chairman Powell presided over the decision for the first time, maintaining the interest rate range at 3.5%-3.75%, but significantly raised the inflation and interest rate projections on the dot plot. Nine officials expect at least one rate hike before the end of the year, prompting the market to reprice for rate hikes instead of rate cuts, putting pressure on risk assets.
Inflation data is equally unkind, with the U.S. May CPI rising by 4.2% year-on-year, reaching a three-year high, primarily due to the Iran conflict driving up energy prices. The core CPI also reached 2.9%, still far from the Fed's 2% target. Additionally, in terms of funding, there continues to be outflows. The U.S. spot Bitcoin ETF saw a significant net outflow in June, peaking at $3.4 billion on Monday, setting the largest single-week record since its listing in January 2024, with a cumulative outflow of $4.21 billion over three weeks.
Future observations will still focus on macro data. The recent decline was triggered by interest rates and inflation, and the key to reversing the current sluggish state also lies with the Fed. Whether yields can loosen, when the Fed will shift to a dovish stance, and whether oil prices can decline are all signals that can determine when funds will flow back in. Until the market clarifies, it is still the most pragmatic decision to cautiously control leverage and manage risks.
Bitcoin four-hour chart
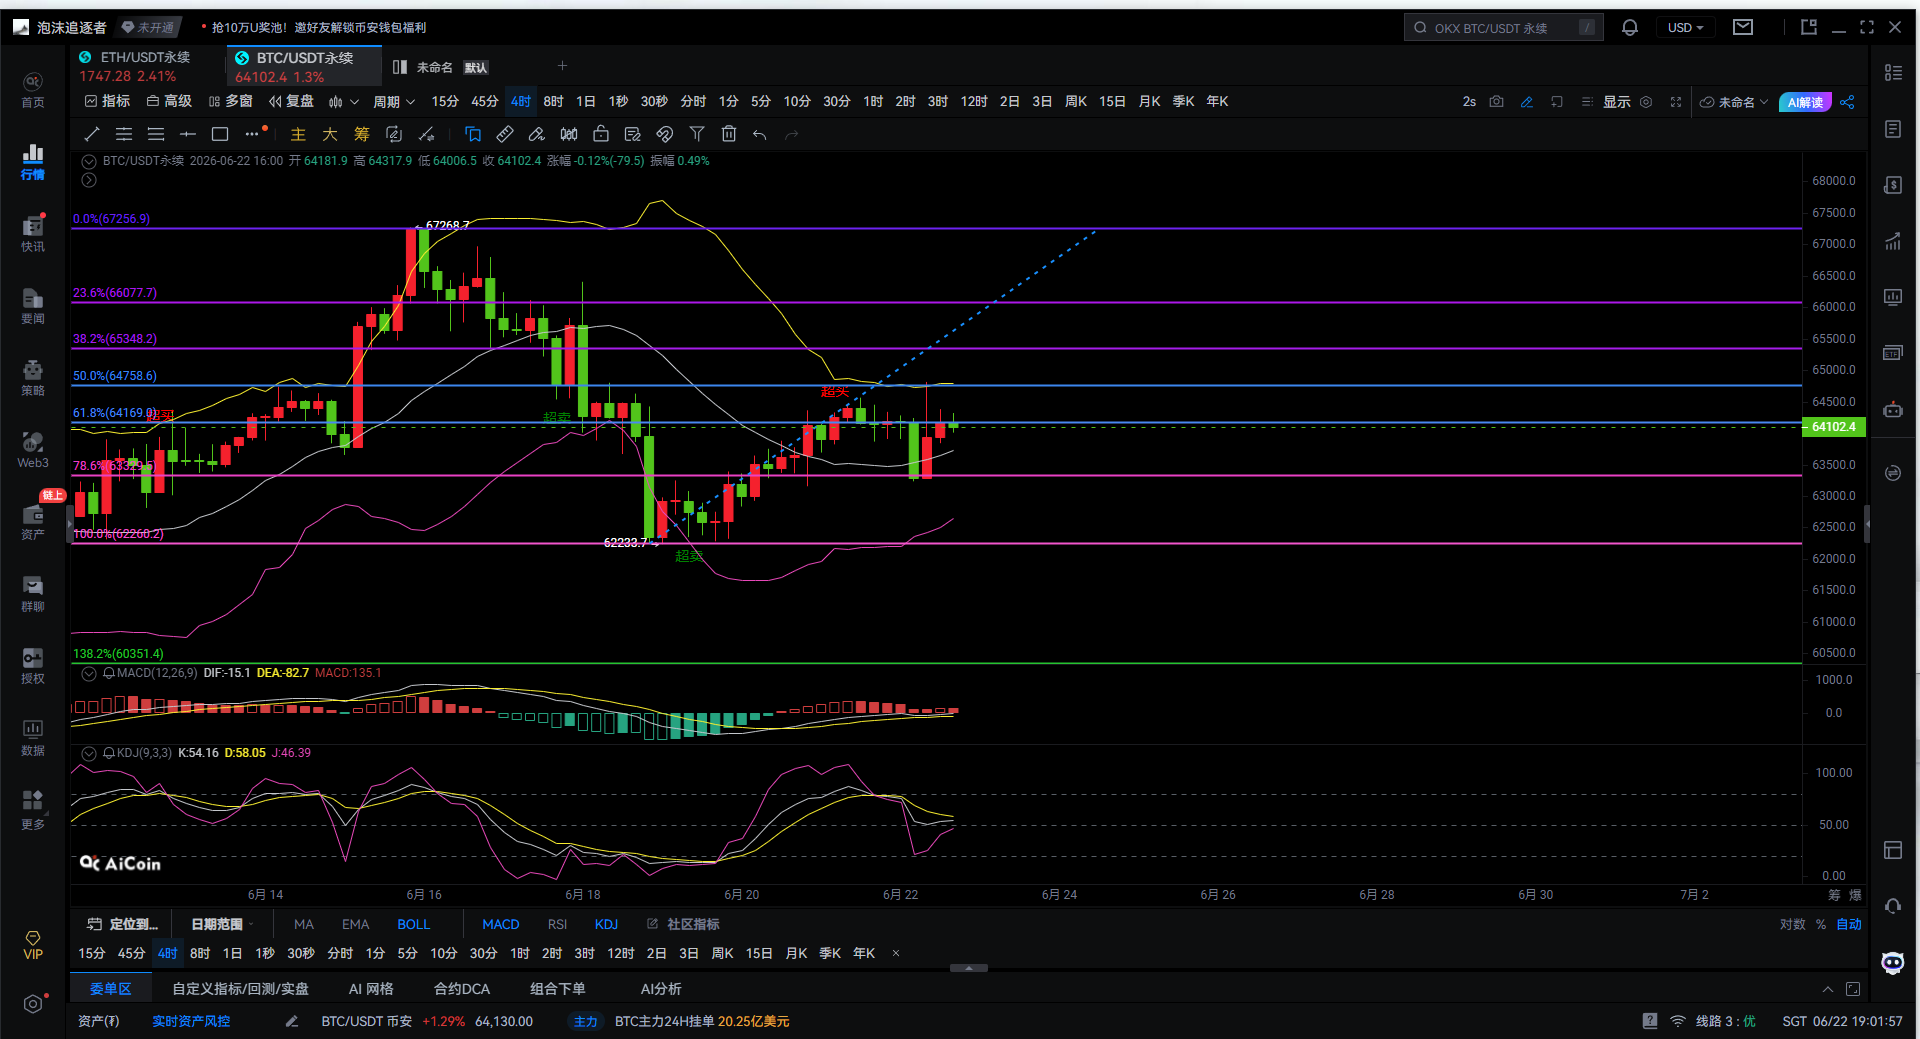
I can clearly tell you: the market has entered a phase of oscillation repair before choosing a direction; it is neither a one-way rise nor a continued crash. Overall, this segment falls from 67,200 to 62,200, then rebounds to 64,100. The essence is a technical pullback after a decline, as it has not exited the reversal and belongs to the end of the first rebound in the downtrend.
In the MACD, the green bars have notably shortened, and the fast and slow lines are beginning to converge, but a golden cross has not yet formed, indicating that the bearish trend is weakening, but the bulls have not truly taken over, which is a typical transitional stage where it neither declines nor rises.
On the KDJ, K and D have risen from oversold territory, while the J value has peaked and begun to decline, showing signs of a turning point, indicating that the short-term rebound has completed half of its journey and is starting to cool down. If J crosses below 50, a short-term pullback is forthcoming.
BOLL is crucial, as the lower support has been tested, the price has returned to near the middle band, and the upper band is starting to level off. This is the first narrowing after the decline, and after the narrowing, there are only two outcomes: either breakout above the middle band to continue the rebound or being pushed back to the lower band for a second bottom test.
From the Fibonacci perspective, the decline from 67,200 to 62,200 has seen the rebound touch the 38.2% level around 63,300 repeatedly, with the 50% level around 64,700 being the current pressure, and the 61.8% level around 65,600 being strong pressure. The current price is stuck between 63,500 and 64,100, which is a typical Fibonacci pressure zone.
Now for some suggestions. The more likely scenario is to face pressure and pull back near 64,700, targeting 63,300 and 62,200, with an extreme drop to 61,000, which would indicate a second bottom structure.
The second suggestion is a stronger scenario; if it breaks through and stands firm above 64,700, it will open up 65,600 and 66,800, but this needs volume support, otherwise, it would be a false breakout.
The third suggestion is a weaker one; if it directly breaks below 62,200, it means the rebound has ended and a new round of decline has begun.
In terms of operational thinking, I will neither chase long nor short now, only focusing on three things: whether 64,700 can hold firm; if it does not hold, then watch for a pullback; whether 63,300 holds; if it breaks, then the pullback begins; whether 64,700 can break with volume; only if broken, I will consider a reversal. The most important conclusion is that this is not a trending market; it is a late-stage rebound with divergent opinions on both sides, making it easy to get burned on both ends.

In summary, currently, the upper pressure zone for Bitcoin is 64,700, while the lower lifeline is 62,200. This feels more like the end of an oscillation rather than the starting point of a trend.
Giving you a hundred percent accurate suggestion is less useful than providing you with the correct mindset and trend. Teaching someone to fish is better than giving them fish; suggestions may earn for a moment, but the mindset learned can earn for a lifetime!
Time of writing: (2026-06-22, 19:00)
(Article by: Master Daxian Talks About Coin) hereby declares: Network publishing has delays, and the above suggestions are for reference only. Investing carries risks; proceed with caution!
免责声明:本文章仅代表作者个人观点,不代表本平台的立场和观点。本文章仅供信息分享,不构成对任何人的任何投资建议。用户与作者之间的任何争议,与本平台无关。如网页中刊载的文章或图片涉及侵权,请提供相关的权利证明和身份证明发送邮件到support@aicoin.com,本平台相关工作人员将会进行核查。