Dear friends, I am Qingtian. Today, the market sentiment is quite complex, and there are two news items worth special attention. One is that a whale has shorted BTC, ETH, and SOL by 20 times, with a floating loss of over $600,000, indicating a huge market divergence, but the floating loss itself also suggests a possible short-term rebound. The other news is that Bitcoin surged 1% in one hour, approaching the $65,000 mark, with strong short-term momentum, but the resistance level is right in front. The combination of these two news pieces indicates fierce long-short battles currently, and a directional choice is about to come. In our Qingtian Crypto Classroom, we have always emphasized that at such nodes, data is more reliable than sentiment, so today we will use the TPV system to analyze the market.
Current Price and Time
The current time is June 22 at 11:59, and the BTC price is reported at 63986 USDT. The 24-hour decline is 0.36%, and the Fear and Greed Index is only 20, which is in the extreme fear zone. At this level, many people are panicking, but I want to remind you that extreme fear often corresponds to a stage of local bottoms, but it does not equate to an immediate reversal; it requires technical signal confirmation.
Overview of Multi-Cycle States
First, let's look at the daily chart. MA5 is at 63619, MA10 is at 64481, MA30 is at 66974, and the price of 63986 is situated between MA5 and MA10, with short-term moving averages coalescing. The MACD histogram value is 459.53, DIF is -2001.30, DEA is -2460.83. Although the histogram value is above the zero line, both DIF and DEA are still negative, indicating that the daily level is in the rebound correction stage of a downtrend, not a trend reversal. The RSI is 53.50, neutral and slightly weak.
4-hour cycle. MA5 is 63981, MA10 is 64091, MA30 is 63850, and the price is oscillating between MA5 and MA10. The MACD histogram value is 59.30, DIF is -56.92, DEA is -116.22. The histogram has been positive for consecutive periods, showing that the rebound momentum is still present, but DIF has not yet broken through the zero line, indicating a weak rebound. The RSI is 62.46, close to the neutral and strong area but not overbought.
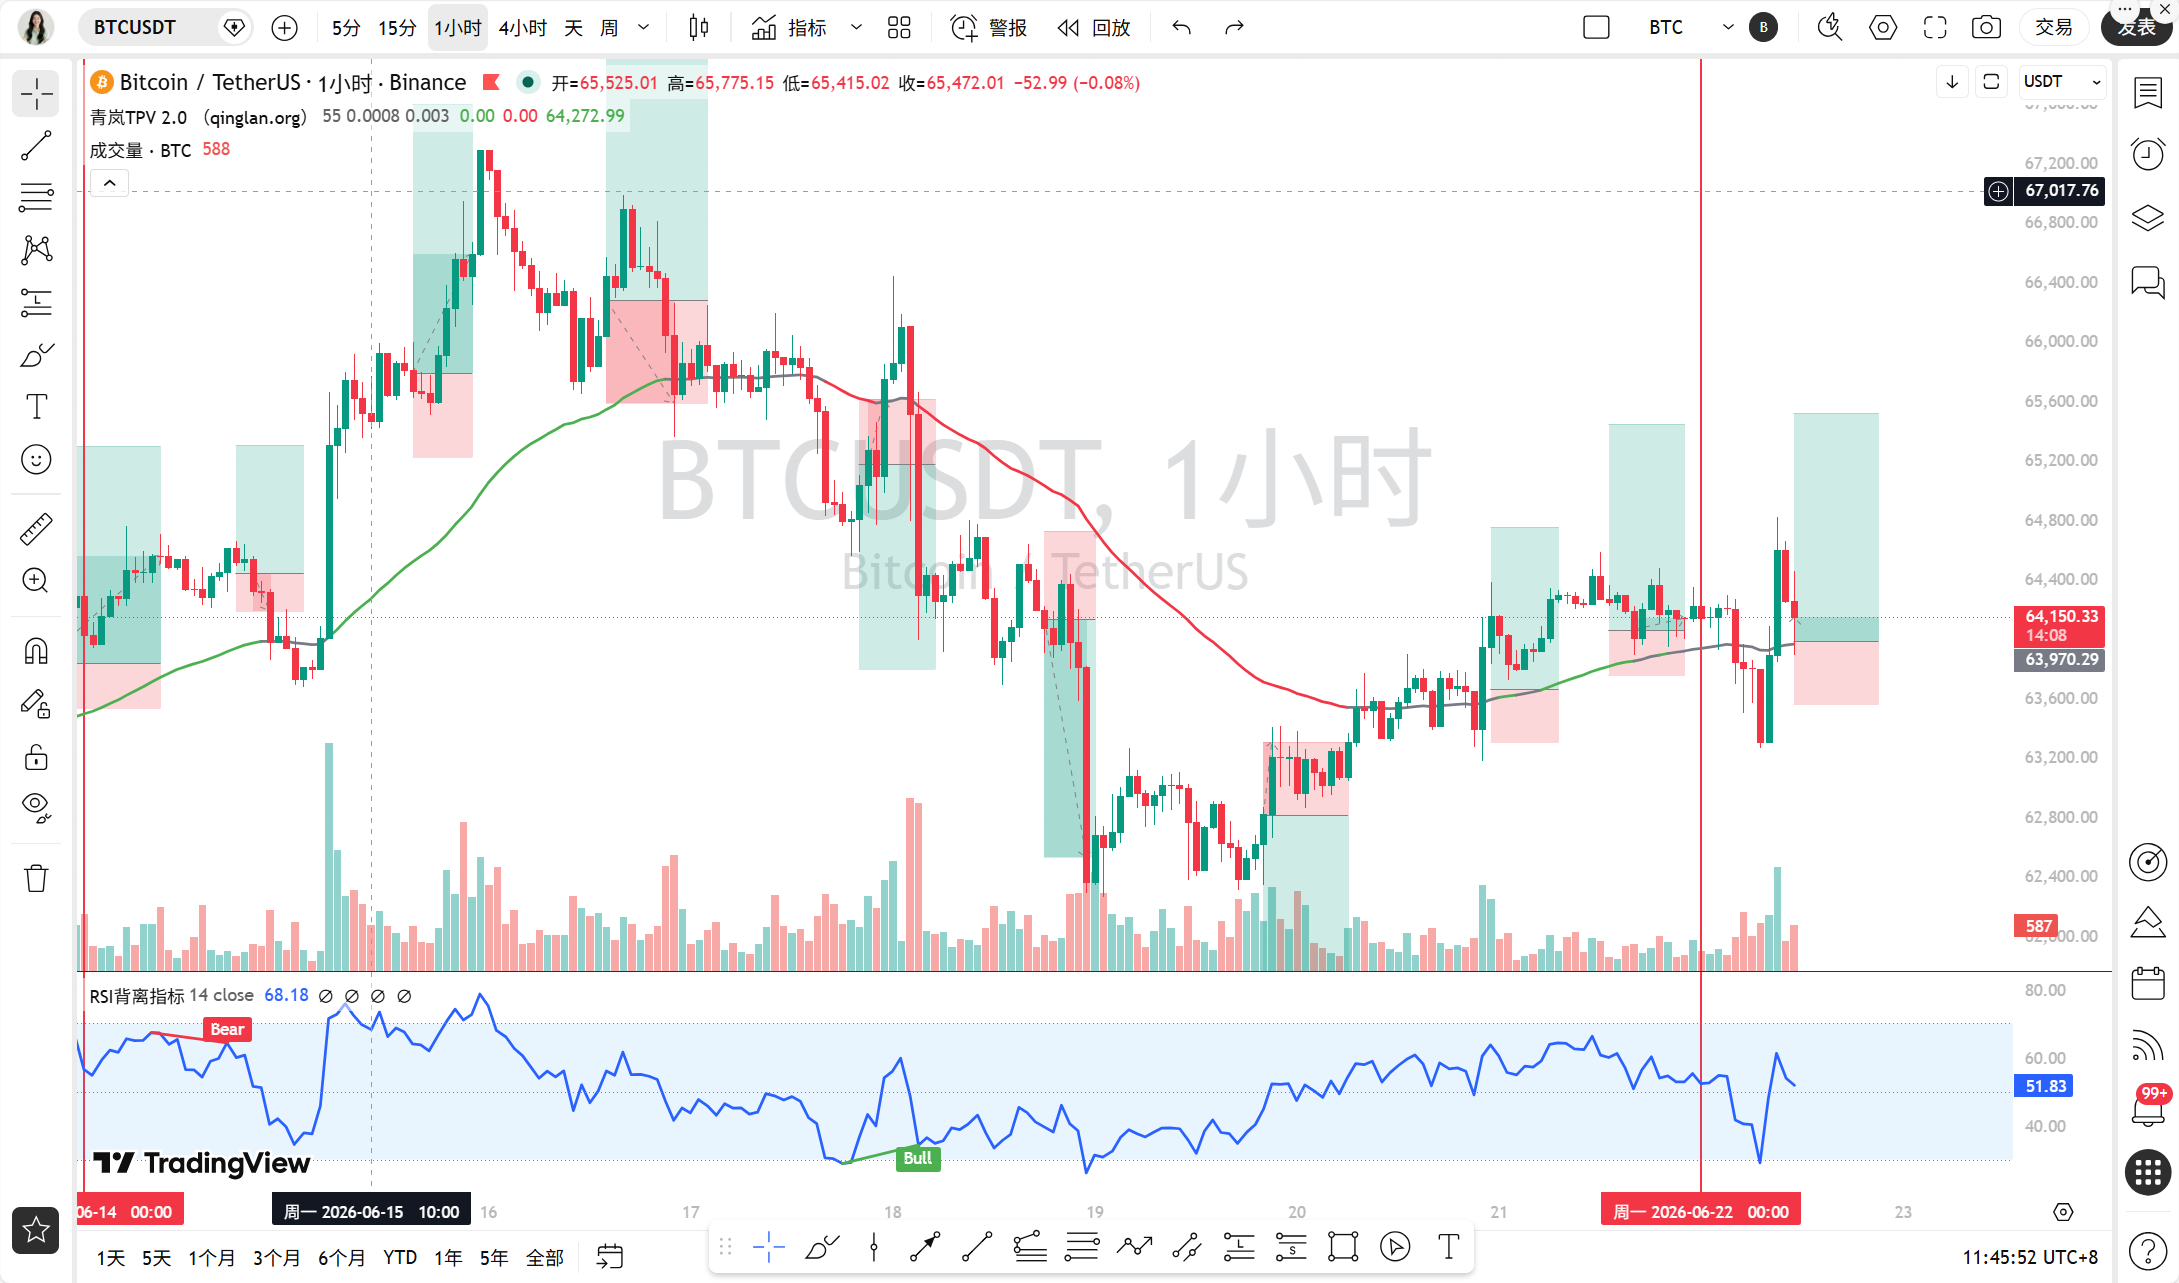
1-hour cycle. MA5 is 64011, MA10 is 63993, MA30 is 64150, and the price of 63986 is slightly below MA30. The MACD histogram value is -4.99, DIF is 7.90, DEA is 12.89, indicating a death cross state, but the negative value of the histogram is very small, indicating limited downward momentum. The RSI is 47.37, neutral and slightly weak. The key EMA55 is at 63885.69, the current price of 63986 is above EMA55, but the amplitude is only 0.16%, which is considered line congestion.
15-minute cycle. MA5 is 64151, MA10 is 64346, MA30 is 63957, and the price is near MA30. The MACD histogram value is -13.47, DIF is 80.70, DEA is 94.18, indicating a death cross, but the RSI is 55.83, in a neutral area, suggesting a possible short-term repair.
In summary, the daily chart is bearish but in rebound, the 4-hour chart shows a weak rebound, and the 1-hour and 15-minute charts are oscillating weakly. No consistent direction has been formed across multiple cycles, which is a typical feature of oscillating markets.
TPV Signal Verification
Now let’s use the TPV system from Qingtian Crypto Classroom to locate positions. The 1-hour EMA55 is at 63885.69, and the current price of 63986 is above EMA55, theoretically in a bullish trend area. However, note that the oscillating auxiliary data shows that among the past 8 1-hour candlesticks, the number of times the closing price was higher than EMA55 is 4 times, with 1 crossover, and the price is 0.16% away from EMA55, which is below the 0.3% threshold. Although the system determines that "the current conditions do not meet the oscillating threshold and may be in a unilateral trend," it also states that "line congestion increases the probability of oscillation." My experience is that when the price is closely attached to EMA55 and there are few crossover occurrences, it represents a fuzzy trend period and cannot simply be treated bullishly.
Let’s look at the conditions for going long. Condition one: The price stabilizes above EMA55, requiring two consecutive 1-hour candlesticks to close above EMA55. The current price just stands above it, but has not formed continuous confirmation. Condition two: Support stabilizes, requiring long lower shadow lines or bottom formations. The most recent 1-hour candlestick has a lower shadow, but it is not long enough and has not formed a significant bottom shape. Condition three: Downward momentum is exhausted, requiring the MACD histogram to shorten for two consecutive periods. The current 1-hour MACD histogram value is -4.99, and the previous one was -5.12, which indeed shows a shortening, but the magnitude is very small, and the RSI at 47.37 has not rebounded from the oversold area. All three conditions are not met, so going long is not possible.
Conditions for going short. Condition one: The price is under pressure below EMA55, and the current price is above EMA55, which does not satisfy. Condition two: Resistance meets pressure, requiring long upper shadow lines or top formations. Recent candlesticks have upper shadow lines, but no effective top formation has been made. Condition three: Weak rebound, requiring the MACD histogram to continuously shorten, but the current histogram shortening occurs after a death cross, which belongs to a decrease in downward momentum, not weak rebound. None of the three conditions are met, so going short is not possible.
Therefore, the current signal from the TPV system is to stay in cash and observe. The oscillating auxiliary data also indicates an increased probability of oscillation, which aligns with our judgment.
On-chain/Funding Situation
In terms of on-chain data, the Fear and Greed Index is 20, indicating extreme fear. Historically, this position often corresponds to local bottoms, but it requires time to digest. BTC's market share is 56.24%, indicating that funds are still seeking refuge in BTC, while altcoins are under greater pressure. In focus news, a whale is shorting 20 times with a floating loss of $600,000; such extreme positions often trigger short squeezes, but a catalyst is needed. Meanwhile, Saylor hinted he might increase BTC holdings next week, which is a potential positive. However, in terms of geopolitical risks, Iran has interrupted negotiations, and Trump has issued a tough warning, which puts downward pressure on risk appetite. Overall, the funding situation is neutral to bearish, but there are short-term rebound dynamics.
Key Offensive and Defensive Levels
The first resistance level above is the 1-hour MA30 at 64150, followed by the 4-hour MA10 at 64091 and the daily MA10 at 64481. The more critical resistance is at the 65000 whole number mark, which is also the sharp surge target mentioned in the news. The first support below is the 1-hour EMA55 at 63885, followed by the 4-hour MA30 at 63850, and further down are the daily MA5 at 63619 and the psychological level of 63000. If it falls below 63000, it will open up space for a downward move.
Trading Thoughts
Based on the TPV system signals and the current market situation, I provide the following trading thoughts.
Direction: Mainly observe and wait for clear signals. If the price pulls back to EMA55 without breaking it and shows a bottom formation, you may take a light long position. If the price rebounds to around 65000 and meets resistance while showing a top formation, you may take a light short position.
Entry Conditions: For going long, the price needs to pull back to the 63885-63900 area, with a 1-hour candlestick appearing with a long lower shadow or bottom formation, and the MACD histogram value starting to rise. For going short, the price needs to rebound to the 64900-65000 area, with a 1-hour candlestick appearing with a long upper shadow or top formation, and the MACD histogram value starting to shorten.
Stop-Loss Levels: Set the long stop-loss below 63700; if it breaks, exit. Set the short stop-loss above 65150; if it breaks, exit.
Target Levels: The first target for going long is 64300, the second target is 64800. The first target for going short is 63500, the second target is 63000.
Risk Reminder
The current market is in a critical stage of long-short battles, with geopolitical and macro data intertwined, and volatility may increase. Please strictly control your position, with single trade risk not exceeding 2% of total funds.
Follow the Qingtian Crypto Classroom for more trading opportunities! Welcome to visit the official website www.qinglan.org
📊 Qingtian TPV Trading Strategy Backtesting Reference
🕒 Last Backtesting Time 06-22 07:00:02
Total Analysis: 2418 Backtests: 1875 Accuracy Rate: 71.4% (1339/1875)
免责声明:本文章仅代表作者个人观点,不代表本平台的立场和观点。本文章仅供信息分享,不构成对任何人的任何投资建议。用户与作者之间的任何争议,与本平台无关。如网页中刊载的文章或图片涉及侵权,请提供相关的权利证明和身份证明发送邮件到support@aicoin.com,本平台相关工作人员将会进行核查。