Coin Circle Liying: 6.21 Bitcoin Latest Market Analysis
The current price of Bitcoin is 63900. By closely observing the details of the market, the signals for a change in trend are becoming faintly visible. In terms of candlestick patterns, the bodies of the last few days are getting smaller, and there are frequent appearances of upper and lower shadows, indicating that there is a great deal of disagreement in the market. Buyers and sellers are fiercely competing at the whole number level of 64000. Regarding moving averages, the EMA7 is about to cross above the EMA30 to form a golden cross, which is a potential short-term buy signal, but it must be accompanied by trading volume. The MACD indicator, although currently above the zero line, has a flat dual-line trend and lacks obvious upward momentum, so caution is needed against the "trap of inducing buying." The narrowing of the Bollinger Bands is the most noteworthy; the distance between the upper and lower bands is decreasing. Typically, such extreme contraction will be followed by a violent one-sided market. The current calm is merely the tranquility before the storm.
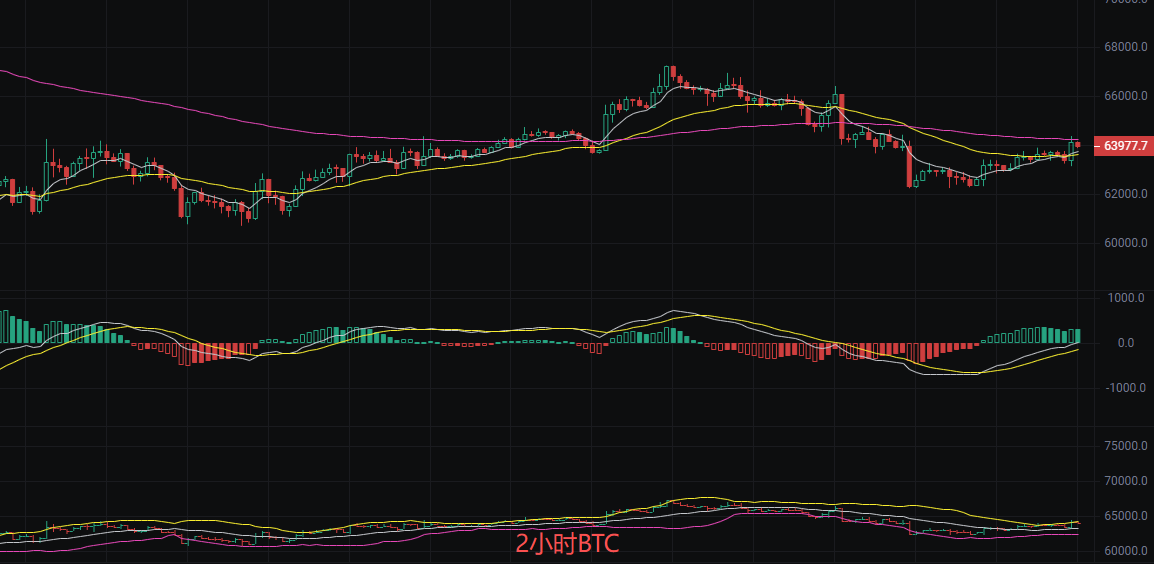
Short-term trading strategy reference:
Buy points 63300-62800, stop loss 62300, target 64000 aiming for 65000
Sell points 64500-65000, stop loss 65500, target 63500 aiming for 62500
Ethereum Latest Market Analysis
Before publication, the current price of Ethereum is 1733. This wave of Ethereum's movement is quite substantial! The current price is 1733, in the recovery phase after a previous sharp drop. However, from the candlestick pattern, the strength of the rebound is gradually weakening, and the EMA7, EMA30, and EMA120 lines have now converged, indicating that short-term, medium-term, and long-term costs are about the same, while bullish and bearish forces are temporarily balanced, lacking a clear trend direction. The MACD shows insufficient momentum for further increases, so caution is warranted regarding retracement risks. Concerning the Bollinger Bands, the price hovers around the mid-band at about 1710, with resistance at the upper band of 1739 and support at the lower band of 1681. The narrowing channel indicates that the market is building up for a significant move; it will either break out or break down, so keep a close eye on key positions!
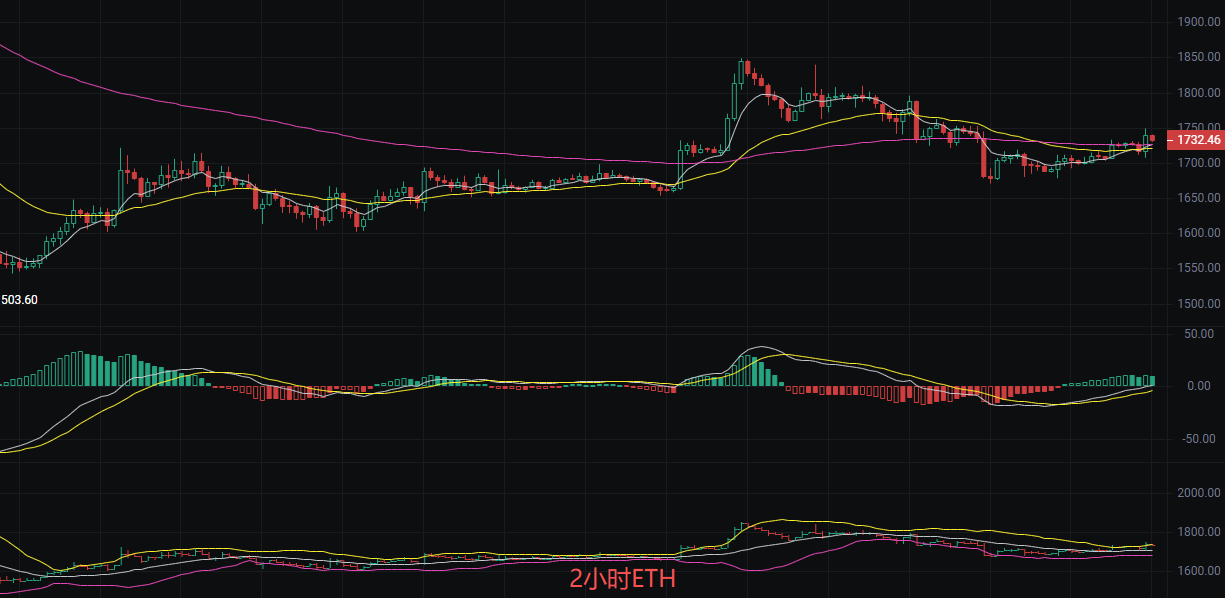
Short-term point reference:
Buy points 1680, support 1630, stop loss 1600, target 1730 aiming for 1800
Sell points 1750, support 1800, stop loss 1830, target 1700 aiming for 1650
The above content is exclusively original by Liying. Please indicate the source when reprinting! The publication of the article is subject to delays in review, and market conditions change rapidly. The above suggestions are for reference only and risks are borne by individuals.

Friendly reminder: The above content is solely created by the author of the public account, and any advertisements at the end of the article and in the comments section are not related to the author. Please discern carefully. Thank you for reading.
免责声明:本文章仅代表作者个人观点,不代表本平台的立场和观点。本文章仅供信息分享,不构成对任何人的任何投资建议。用户与作者之间的任何争议,与本平台无关。如网页中刊载的文章或图片涉及侵权,请提供相关的权利证明和身份证明发送邮件到support@aicoin.com,本平台相关工作人员将会进行核查。