Dear friends, I am Sister Qinglan. This morning, there was a subtle change in market sentiment. In the key news, Bitcoin broke through $64,000 triggering a short liquidation intensity of $786 million, which is a short-term bullish signal indicating that shorts are being forced to close, enhancing the short-term upward momentum. However, at the same time, bad news regarding liquidity contraction is suppressing Bitcoin prices, and concerns about market liquidity exhaustion still exist. These two pieces of news contrast sharply; on one hand is the short-term short squeeze momentum, and on the other hand is the mid-to-long-term liquidity concerns, which reflect the complexity of the current market conditions. We must find direction through data, rather than being swayed by emotions.
Current Price and Time
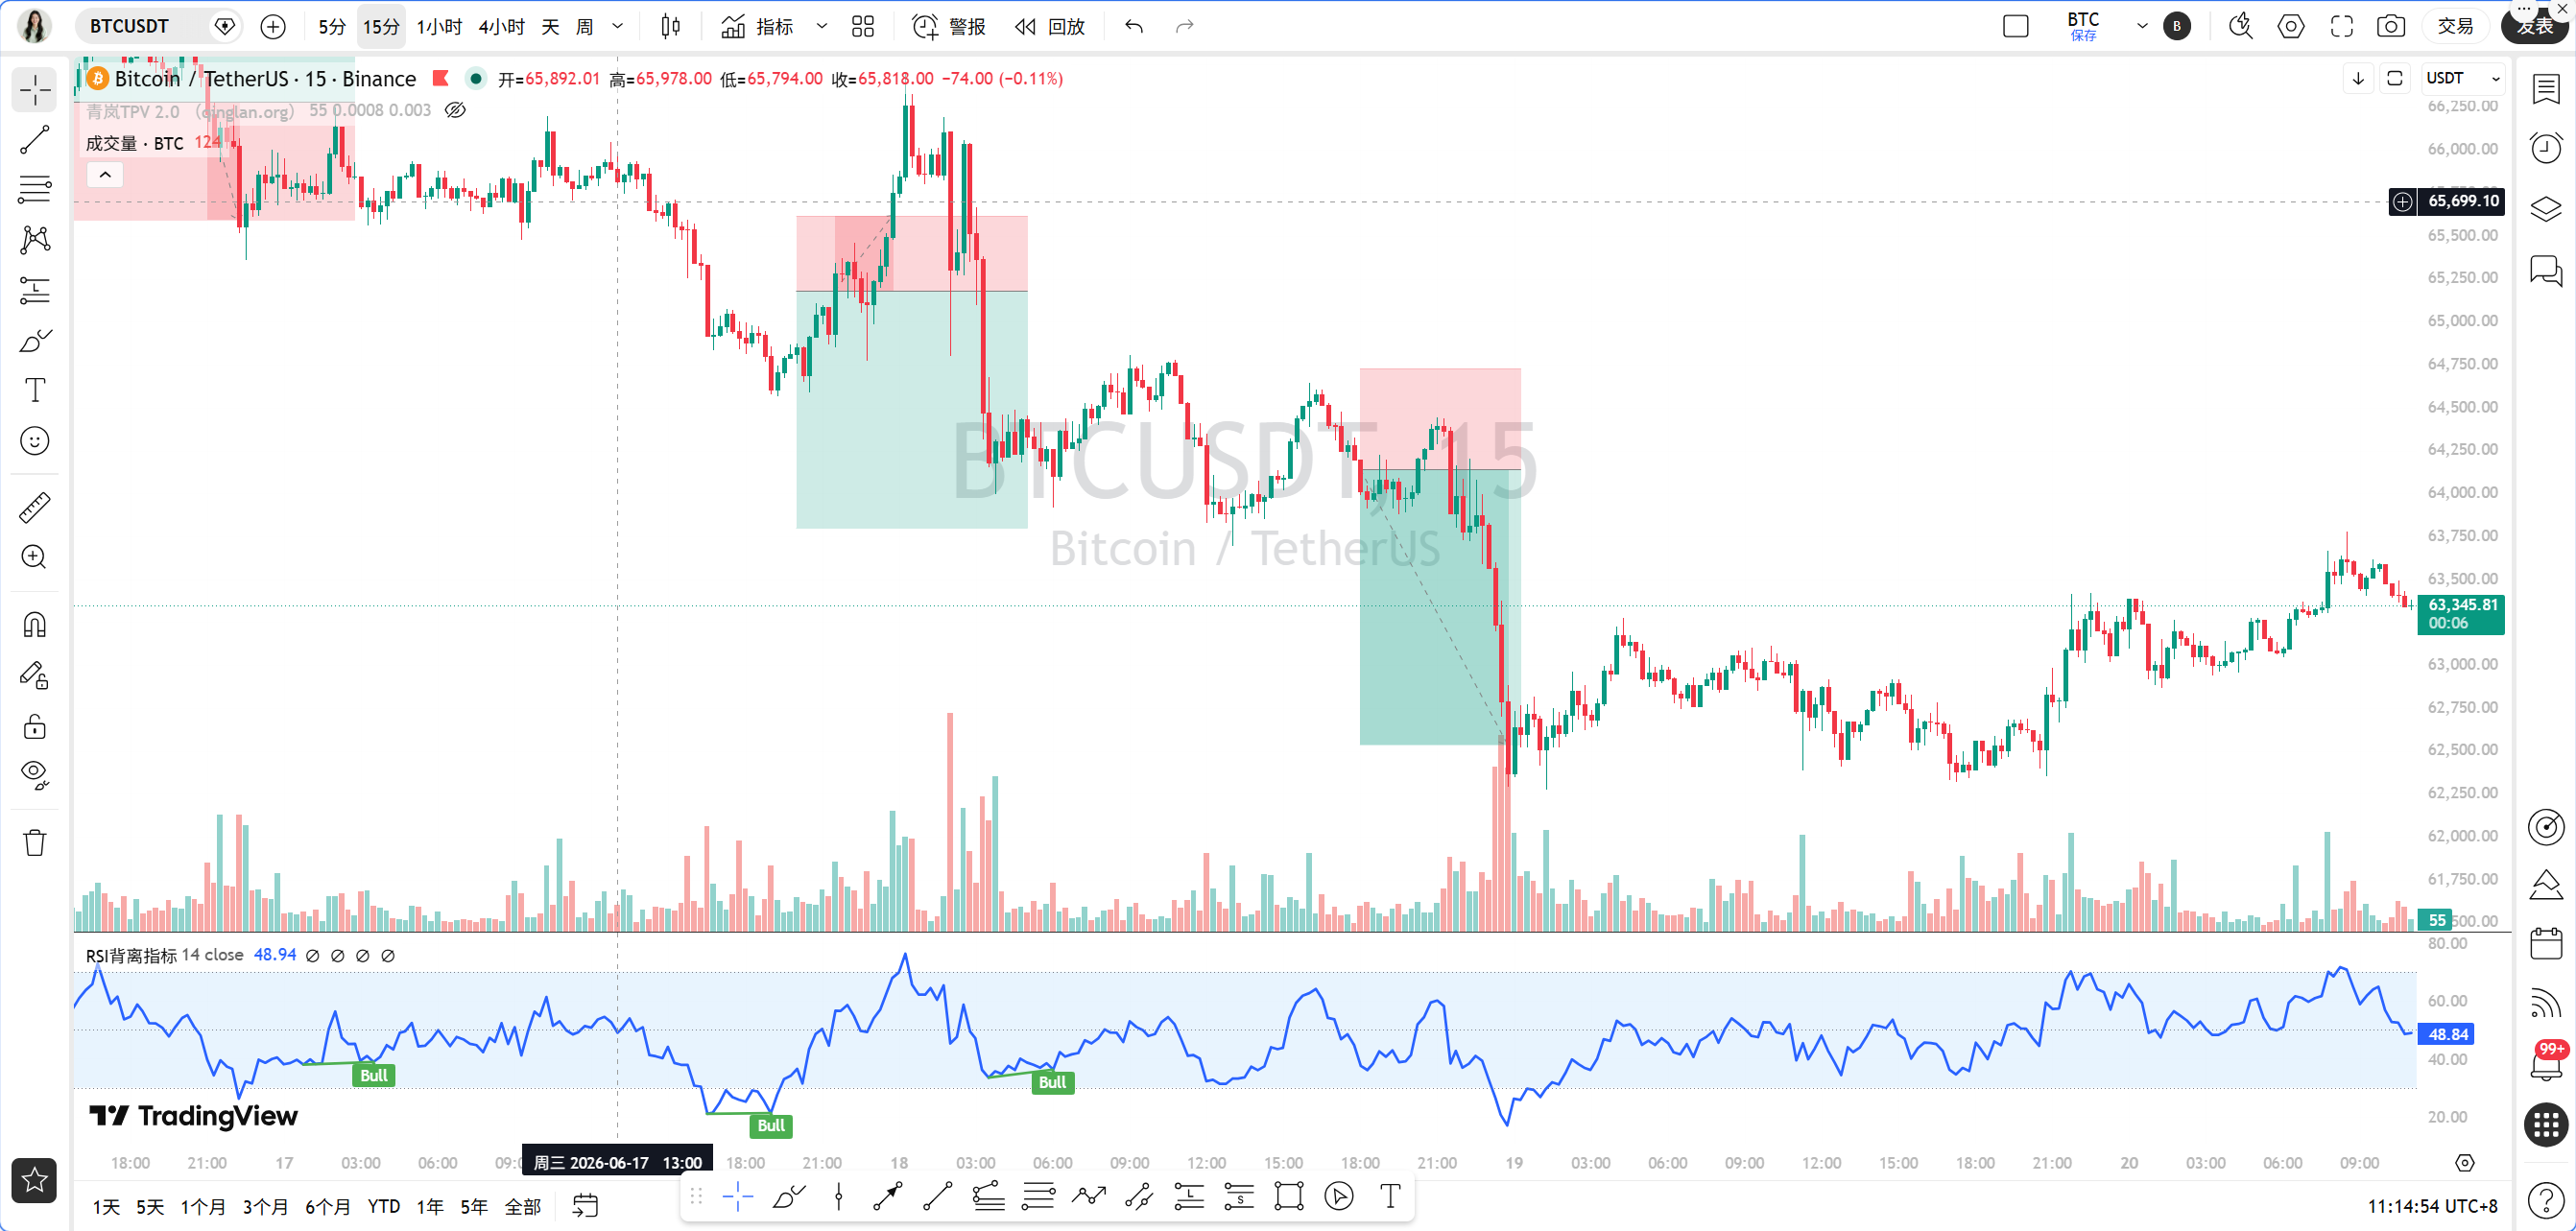
The current time is June 20, 11:15 AM, with Bitcoin quoted at 63,358 USDT. The 24-hour increase is 0.71%, and the Fear and Greed Index is 23, falling within the extreme fear range. At this position, there is a large divergence between bulls and bears, but the data will tell us the truth.
Overview of Multiple Timeframes
First, looking at the daily chart, MA5 is at 64,008, MA10 is at 64,378, and MA30 is at 67,775, with prices below all moving averages, indicating a bearish arrangement. The MACD's DIF is at -2,270, DEA is at -2,700, and although the histogram has narrowed to 429, it remains below the zero line, indicating a bearish trend at the daily level. The RSI is at 59.28, which is not extreme but also not strong.
On the 4-hour timeframe, MA5 is at 63,152, MA10 is at 62,944, and prices are above these two moving averages, showing signs of short-term stabilization. However, MA30 is at 64,711, which is strong resistance above. The MACD's DIF is at -500, DEA is at -454, and the histogram is at -46, with bearish momentum weakening, but it has not yet turned bullish. The RSI is at 40.95, neutral but slightly weak.
On the 1-hour timeframe, MA5 is at 63,471, MA10 is at 63,313, and MA30 is at 63,009, with prices oscillating between the moving averages. EMA55 is at 63,537, which is the key boundary of the Qinglan TPV system. The current price of 63,358 is below EMA55, indicating a bearish area. The MACD's DIF is at 69, DEA is at 0.33, and the histogram is at 68, showing bullish momentum still exists, but DIF and DEA are very close, posing a risk of a death cross. The RSI is at 53.97, neutral.
On the 15-minute timeframe, MA5 is at 63,372, MA10 is at 63,444, and MA30 is at 63,343, with prices fluctuating around the moving averages. The MACD histogram is at -33, indicating bearish momentum. The RSI is at 36.41, slightly weak.
Summary: Daily is bearish, 4 hours are stabilizing, 1 hour is slightly bearish, and 15 minutes are weakening. Multiple timeframes resonate downwards, but the 4-hour provides support, so it is not a one-sided crash, but a fluctuating downward pattern.
TPV Signal Verification
Now let's verify using the Qinglan TPV system. The core rule is that the 1-hour EMA55 is the boundary between bullish and bearish. The current price of 63,358 is below EMA55 of 63,537, indicating a bearish trend region.
Check for short conditions. First, the price is under pressure below the 1-hour EMA55. In the past 8 1-hour candles, the closing price was above EMA55 only 2 times, and crossed it 4 times, indicating the price repeatedly crossed near EMA55, but most closing prices are below it, meeting the conditions. Second, there is resistance. On the 15-minute timeframe, the price showed long upper shadows between the 63,400-63,500 range, indicating significant selling pressure above. Third, the rebound lacks strength. Although the 1-hour MACD histogram is positive, DIF and DEA are very close; if the subsequent histogram shortens, it will signal momentum exhaustion. The 15-minute MACD histogram has turned negative, and the RSI has dropped from 53 to 36, indicating signs of weak rebounds.
However, note that the oscillation assisting data shows that the current price's absolute amplitude from EMA55 is 0.28%, which is less than 0.3%, falling within line fluctuation, increasing the probability of oscillation. The past 8 candles crossed 4 times, which also fits the oscillation characteristics. Therefore, although the short conditions are met, this is not a strong bearish trend but rather a bearish oscillation. The Qinglan TPV system stipulates that in oscillating markets, do not actively go long or short, only provide ranges. Thus, we do not take aggressive one-sided positions but look for key positions within the range.
On-chain Funding Dynamics
In terms of on-chain data, the Fear and Greed Index is at 23, indicating extreme fear, suggesting retail sentiment is pessimistic, but this is often a characteristic of bottom regions. Large whales are increasing their holdings of ETH and WBTC, showing institutional confidence for a long-term bullish outlook. However, Chainlink has deposited a large amount of LINK into exchanges, potentially triggering selling pressure. The strength of the US dollar index pressures Bitcoin. Rising geopolitical risks may dampen sentiment for risk assets. Overall, the funding dynamics lean bearish, but whale activities provide bottom support.
Key Offensive and Defensive Levels
The first resistance level above is the 1-hour EMA55 at 63,537; if the price stabilizes here, it may turn bullish. The second resistance level is the 4-hour MA30 at 64,711, which is strong mid-term resistance. The first support level below is the 4-hour MA5 at 63,152; the second support level is the 4-hour MA10 at 62,944; if the price breaks below these levels, it may test previous daily lows. The key range is between 62,944 and 63,537, which is the focus of the current bullish-bearish struggle.
Trading Ideas
Based on the Qinglan TPV system, the current situation is in a bearish oscillation pattern; do not take aggressive one-sided positions, just engage in short-term trades within the range.
Direction: Short-term biased bearish, but operate strictly within the range.
Entry Conditions: If the price rebounds to the 63,500-63,550 range and there is a 15-minute long upper shadow or a bearish engulfing pattern, a light short position can be taken. If the price pulls back to the 63,000-62,950 range and shows a 15-minute long lower shadow or bottom formation, a light long position can be taken. Note that this is a bidirectional trade within the oscillating range, not a trend position.
Stop Loss: Set the short stop loss above 63,700 and the long stop loss below 62,850.
Target Position: The short target looks towards the 63,100-63,000 area, and the long target looks towards the 63,400-63,500 area. Take profits within the range and do not be greedy.
Risk Warning
Currently in line fluctuation, with a high probability of oscillation; any one-sided chasing rallies or selling off could lead to repeated losses, so always use light positions and strict stop losses.
Follow the Qinglan Crypto Classroom to seize more trading opportunities! Welcome to visit the official website www.qinglan.org
📊 Qinglan TPV Trading Strategy Backtest Reference
🕒 Last Backtest Time: 06-20 07:00:01
Total Analysis: 2371 Backtests: 1847 Accuracy Rate: 71% (1311/1847)
免责声明:本文章仅代表作者个人观点,不代表本平台的立场和观点。本文章仅供信息分享,不构成对任何人的任何投资建议。用户与作者之间的任何争议,与本平台无关。如网页中刊载的文章或图片涉及侵权,请提供相关的权利证明和身份证明发送邮件到support@aicoin.com,本平台相关工作人员将会进行核查。