Firstly, the model has made an important switch
Yesterday, our quantitative model issued an important signal:
The direction of BTC has switched from bullish to bearish.
This is not an emotion-driven judgment, but a data-driven result.
At the same time as the model switched direction, altcoin signals are still profitable:
Cryptocurrency | Signal Time | Alert Price | Current Price | Price Change | Duration |
|---|---|---|---|---|---|
BASED/USDT | June 19 02:15 | $0.0840 | $0.1040 | +23.9% | 8h |
HOME/USDT | June 18 09:14 | $0.0302 | $0.0360 | +19.1% | 8h |
SOXL/USDT | June 18 07:14 | $247.80 | $280.16 | +13.1% | 24h |
QNT/USDT | June 18 08:14 | $62.84 | $69.67 | +10.9% | 24h |
BTC direction switched, signals are still profitable.
This is the value of the quantitative model—regardless of the market direction, signals are always looking for opportunities.
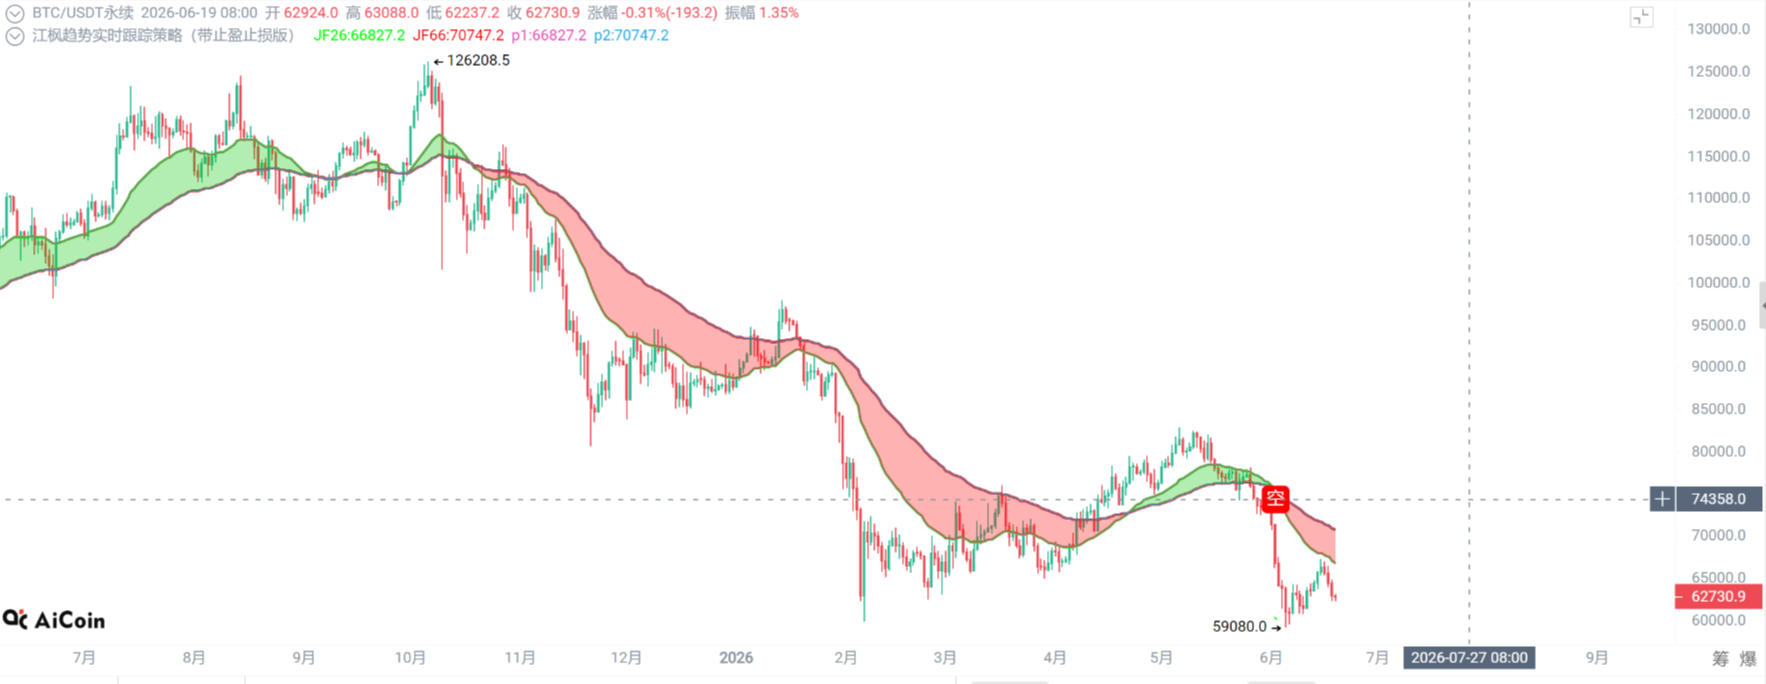
Today's BTC: $62,600, rapidly falling from $67,300
Today's price of BTC is $62,600. Let’s review this trend:
June 6: Lowest $59,200
June 8: Rebounded to $64,000
June 16: Highest surged to **$67,300**
Today: Fell back to **$62,600**, a decline of about 7% in 3 days
What caused BTC to rapidly fall from $67,300?
The answer is simple: New Federal Reserve Chair Warsh is more hawkish than everyone expected.
The FOMC meeting that changed everything
Warsh did something that caught the market off guard
On June 16-17, new Federal Reserve Chair Kevin Warsh presided over his first FOMC meeting.
The meeting results were in line with expectations: Maintaining the interest rate at 3.50%~3.75% unchanged.
But the manner of the meeting completely shocked the market:
Warsh completely eliminated the traditional forward guidance and significantly shortened the official FOMC statement.
More importantly: Half of the FOMC members expect another rate hike within the year.
The market quickly repriced, raising the probability of a rate hike from nearly zero to 90%.
What does this mean?
The liquidity expectation changed from "waiting for a rate cut" to "possibly more rate hikes", which is the signal that risk assets least want to see.
BTC started to decline directly from the $67,300 area, ETFs faced heavy blows, BTC fell below $63,000, triggering over $1.1 billion in liquidations.
Why did the model switch to bearish?
Our quantitative model switched the BTC direction from bullish to bearish after a comprehensive analysis of the following data:
✅ FOMC hawkish beyond expectations — 90% probability of rate hikes, liquidity tightening expectations significantly rise ✅ BTC breaks key support — The $65,000~$66,000 support zone has been broken, the bullish defense line has collapsed ✅ ETF funds are flowing out again — Institutions accelerated withdrawals after Warsh's speech, buying pressure disappeared ✅ RSI weakened again after bouncing from the oversold zone — The rebound momentum has exhausted, the bears regained dominance
Four signals pointing to bearishness, the model switches direction.
This is not bearish sentiment, but a rational judgment following the data.
Technical analysis: $67,300 has become the new top resistance
Current price structure redefined
New resistance levels:
$67,300: The peak of the current rebound, a new strong resistance level, an ideal position for bearish positions
$65,000~$66,000: Previously broken levels, turned into a pressure zone after being lost
Current support levels:
$61,000~$62,500: The most important support area currently, tested multiple times
$59,200: The extreme low point of this round, breaking it would trigger a new round of decline
$58,000~$60,000: The technical target range after the FOMC leaning hawkish
Mid-term key level:
BTC needs to recover $73,869 (Fibonacci 0.236 level) to neutralize the current bearish structure
Analyst Cowen believes that the BTC cycle bottom may be around October 2026
RSI signal: Rebound failure
BTC’s previous RSI bounced from the extremely oversold range but weakened again after encountering selling pressure around $67,300.
RSI's decline after the rebound is a typical characteristic confirming bearish technical signals.
Three scenario simulations
Scenario 1: $61,000~$62,500 holds, consolidates (probability 40%)
Trigger conditions: The support zone holds effectively, panic over rate hikes gradually dissipates
Target path:
Consolidate horizontally in the $61,000~$65,000 range
Wait for the next macro catalyst (July FOMC or CPI data)
Structural opportunities in altcoins continue to emerge, just like BASED today +23.9%
Scenario 2: Falls below $61,000, tests $59,200 (probability 40%)
Trigger conditions: Continuous net outflows from ETFs, the market digests 90% rate hike expectations
Target path:
Re-test the June 6 low of $59,200
If it holds, it will form a double bottom, technically favorable for subsequent rebounds
If it breaks down, look down to $57,500~$58,000
This is currently one of the two scenarios with the highest probability according to the model.
Scenario 3: Rebounds to recover $65,000 (probability 20%)
Trigger conditions: Macro data improves beyond expectations, rate hike expectations cool down
Target path:
Re-establish above $65,000, restoring the bullish pattern
However, in the face of a 90% rate hike expectation, this requires a very strong catalyst
A bottom signal worth noting: Long-term holders are reducing sell-offs
Despite short-term bearishness, there is one on-chain data point worth noting:
The activity of old coins is declining, and long-term holders' selling activity is decreasing, which is a common signal that the bear market is approaching an end.
What does this mean?
In the short term, BTC may continue to face pressure, but in the long term, chips are shifting from weak hands to strong hands, which is a characteristic that appears before every major bottom.
Short-term bearish, long-term bullish, not contradictory.
Why did the model switch to bearish while altcoin signals are still profitable?
Many people think that BTC bearish means everything will fall.
But our model focuses on structural identification:
Even when BTC is falling, there are still altcoins strengthening independently.
Yesterday, while BTC fell from $67,300:
BASED: 8 hour **+23.9%**
HOME: 8 hour **+19.1%**
SOXL: 24 hour **+13.1%**
QNT: 24 hour **+10.9%**
Four signals, four profits.
The reason is: During BTC's fluctuating decline, the major players concentrate funds on a few altcoins to create independent markets.
Our model captures the traces of this "localized capital concentration".
Recent complete performance
Cryptocurrency | Signal Alert Price | Highest Price Change |
|---|---|---|
ALLO (first time) | $0.098 | +268% |
H (first time) | $0.26 | +231% |
LAB | $6.00 | +167% |
ALLO (again) | $0.2245 | +80.2% (8h) |
COAI | $0.3483 | +77.7% (24h) |
OPN | $0.1433 | +68.8% (8h) |
BSB | $0.2598 | +55.0% (8h) |
PIPPIN | $0.0198 | +40.3% (8h) |
OPG | $0.1733 | +26.1% (24h) |
XPL | $0.0709 | +21.8% (8h) |
MEGA | $0.0531 | +18.3% (8h) |
H (again) | $0.5850 | +17.6% (24h) |
HMSTR | $0.0002 | +17.4% (24h) |
SENT | $0.0149 | +15.7% (4h) |
CHIP | $0.0378 | +10.1% (4h) |
BASED | $0.0840 | +23.9% (8h) |
HOME | $0.0302 | +19.1% (8h) |
SOXL | $247.80 | +13.1% (24h) |
QNT | $62.84 | +10.9% (24h) |
BTC switched between long and short, signals continue to profit, the model does not rely on a single direction.
Regardless of BTC's rise or fall, the next signal is on the way
The direction of BTC has switched to bearish, which is the result of data, not sentiment.
But no matter which direction BTC moves, our altcoin signals are still operational.
The only question is: Are you in?
Join the AlphaQuant altcoin signal community
👉 t.me/alphaquant_lixia

After joining the group, send the words "Bearish" to receive for free:
✅ Complete analysis report and operational suggestions for BTC bearish signals
✅ Complete signal screenshots and entry logic for BASED, HOME, SOXL, QNT
✅ Recent historical records of all 19 signals (including screenshots)
✅ The next potential target currently being tracked by the model
Currently free for experience, first come, first served.
Today's operational suggestions
BTC operations (bearish direction):
Conservative: Place a short position in the $64,000~$65,500 rebound zone, stop loss above $67,500, target $59,200~$61,000
Aggressive: Wait for a break below $62,500 to chase the short, target $59,200
Conservative: Mainly watch, waiting for further confirmation of direction
Altcoin layout:
During the BTC bearish period, there are still opportunities for altcoins to strengthen independently
The model continues to scan for "localized capital concentration" signals, not stopping due to BTC's direction
Each position should strictly control within 10% of total funds
Stop losses should be stricter than during bullish periods, as bearish environments are more volatile
Disclaimer: The content of this article is for learning reference only and does not constitute any investment advice. The cryptocurrency market is highly risky, past signal performance does not guarantee future returns, please make independent judgments based on your risk tolerance.
#BTC #Bitcoin #Bearish #FOMC #Warsh #BASED #HOME #QuantitativeSignal #AlphaQuant #TechnicalAnalysis
免责声明:本文章仅代表作者个人观点,不代表本平台的立场和观点。本文章仅供信息分享,不构成对任何人的任何投资建议。用户与作者之间的任何争议,与本平台无关。如网页中刊载的文章或图片涉及侵权,请提供相关的权利证明和身份证明发送邮件到support@aicoin.com,本平台相关工作人员将会进行核查。