Cryptocurrency Academy: 6.19 Bitcoin Day K + Four Hour Chart In-Depth Analysis! Latest Market Analysis and Operation Suggestions
The current price of Bitcoin is 62600, having learned a lesson; indeed, all pullbacks are traps. From the daily K-line perspective, Bitcoin is currently closing at 62619 points, with the price falling below the EMA15, EMA30, and other short-term moving averages. Overall, the moving averages are arranged southward, with a strong resistance forming around 70000 at the upper EMA60, indicating a bearish trend. The MACD indicator shows that DIF and DEA are still operating below the zero axis. Although the green column is contracting, the downward momentum has not completely exhausted. The Bollinger Bands are opening downward, the price has fallen below the middle band, and is currently operating near the lower band, with support around 57600 points. The rebound strength at the daily K-level is weak, remaining in a downward channel overall, with no clear reversal signal; in the short term, the trend is primarily a weak bearish fluctuation.
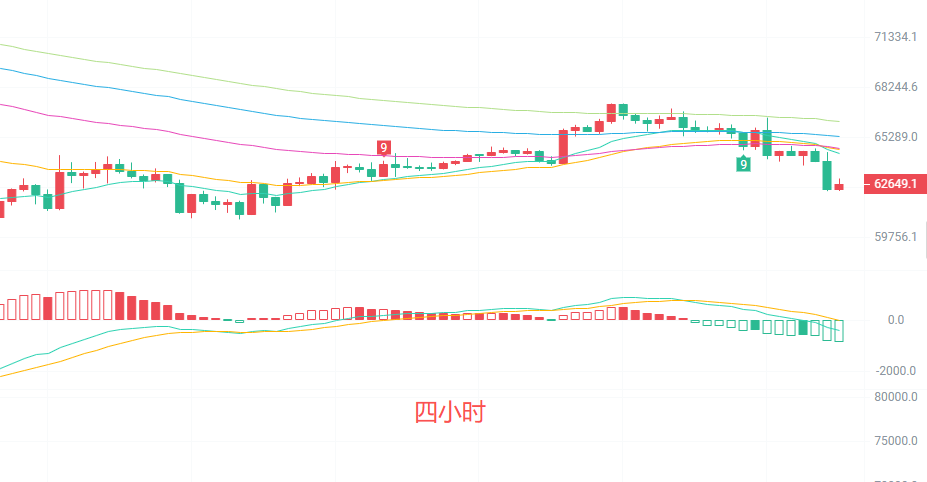
On the four-hour level, Bitcoin's current price is 62627 points, again breaching the EMA15 short-term moving average, causing the moving average system to turn downward, ending the upward trend. The MACD indicator's DIF line has broken down through the DEA line, and the green column has begun to expand, reigniting downward momentum. The middle band of the Bollinger Bands is exerting pressure around 65200; after breaching the middle band, the price is approaching the lower band at 62690 points, with the lower band support having been briefly broken. The four-hour level rebound has declared failure, allowing the southward control to resume the rhythm, with the high points of the short-term rebound continuously decreasing, indicating a strong continuation of the downward trend. Operationally, the main thought should be directed southward, with caution against short-term rebound traps.
Short-term strategy reference: Follow the trend of the larger cycle, with small stop-losses for quick entries and exits
Buy when the price is between 61000 and 60500, stop loss at 60000, target looking at 62000 to 63000
Sell when the price is between 64500 and 65000, stop loss at 65500, target looking at 63500 to 62500
Specific operations should be based on real-time market data; for more news details, you can consult the author. The article publication may be delayed; suggestions are for reference only, with risks undertaken by the reader.

Kind reminder: The above content is solely created by the author of the public account. The advertisements at the end of the article and in the comments section are unrelated to the author; please identify carefully. Thank you for reading.
免责声明:本文章仅代表作者个人观点,不代表本平台的立场和观点。本文章仅供信息分享,不构成对任何人的任何投资建议。用户与作者之间的任何争议,与本平台无关。如网页中刊载的文章或图片涉及侵权,请提供相关的权利证明和身份证明发送邮件到support@aicoin.com,本平台相关工作人员将会进行核查。