Cryptocurrency Expert: Is the divergence in Ethereum's six-month cycle on 6.17 showing on the charts? Latest market analysis and trading suggestions
The current price of Ethereum is 1800. Ethereum is currently consolidating around 1800, with the market at a balance point between bulls and bears. There is no absolute upward movement, nor any absolute downward movement. Here’s a piece of honest advice: do not guess the top or the bottom, just go with the trend. The daily chart shows resistance at the upper limit and support at the lower limit on the four-hour chart; within this range, do not chase the rise or bottom fish. Wait for signals to materialize before taking action.
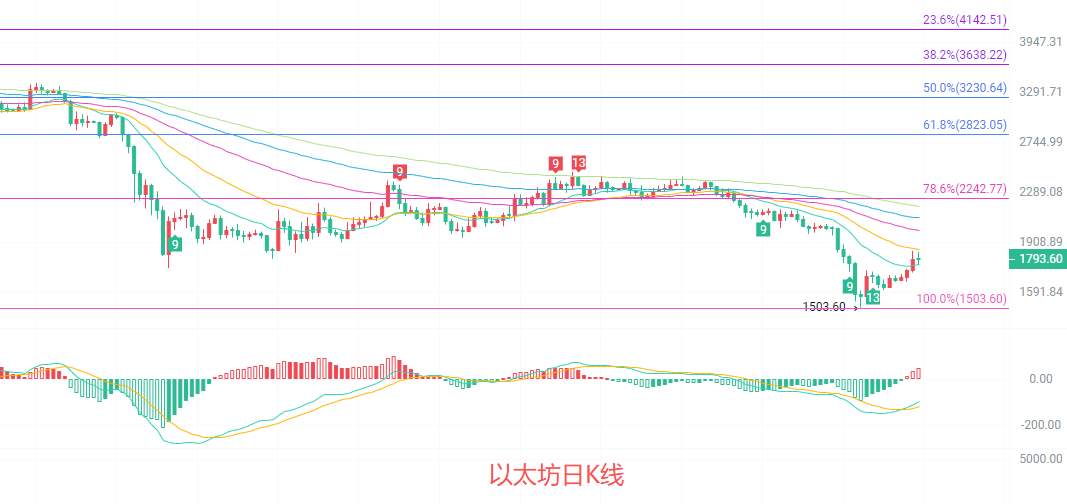
The overall trend of the daily candlestick chart is still in a recovery phase after a deep decline. The previous low of 1503 serves as the ultimate support for this decline. The moving averages are all aligned downward, with price moving below the 120-day line at 2175, and the mid to long-term downward pattern has not completely reversed; the Bollinger Bands are narrowing, with the upper band at 2084 forming strong resistance and the lower band at 1478 providing extreme support. There is rebound momentum in the MACD, but the volume strength is relatively weak. The key Fibonacci resistance level is at 1900, which is the 100% retracement level of the decline. For the daily chart to reverse the downward trend, it must stabilize above 1908; otherwise, any rebound would merely be defined as a repair during the ongoing decline, and the long-term downward background remains unchanged.
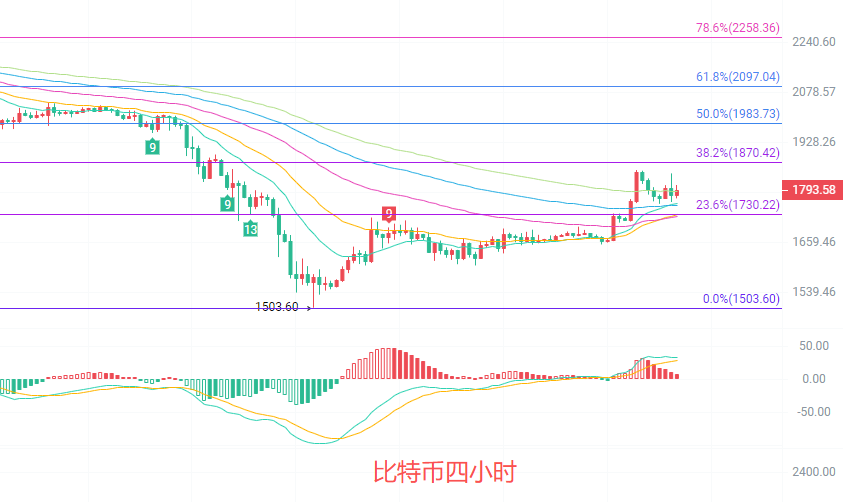
The short-term EMA15 and EMA30 moving averages on the four-hour chart are stabilized, with the short-term moving averages diverging upwards, forming a short-term support range of 1720-1730, corresponding to the Fibonacci 23.6% rebound level. The Bollinger Bands are opening upwards, with the price running closely below the upper band at 1852, and the channel is continuously expanding, favoring an upward movement in the short term. The upward momentum in the MACD is only slightly declining, with no reversal signal. The first resistance level above is the 38.2% Fibonacci at 1870, with strong resistance at 1970. Short-term support lies at 1760 and strong support at 1730; as long as it does not break below 1730, the four-hour rebound structure remains intact, and any pullback presents a buying opportunity.
Short-term reference:
Sell from 1870 to 1920 downward, stop loss at 1950, target looking at 1820 to 1780
Buy from 1760 to 1730 upward, stop loss at 1700, target looking at 1800 to 1850
Specific operations should rely on real-time data from the market. For more detailed information, please consult the author. Publication of this article may be delayed, advice is for reference only and risks are to be borne by the reader.

Friendly reminder: The above content is only created by the author on Weibo; advertisements at the end of the article and in the comments section are unrelated to the author. Please distinguish carefully, thank you for reading.
免责声明:本文章仅代表作者个人观点,不代表本平台的立场和观点。本文章仅供信息分享,不构成对任何人的任何投资建议。用户与作者之间的任何争议,与本平台无关。如网页中刊载的文章或图片涉及侵权,请提供相关的权利证明和身份证明发送邮件到support@aicoin.com,本平台相关工作人员将会进行核查。