Dear friends, I am Sister Qinglan. Today, market sentiment has clearly warmed up, and there are two major news items worth focusing on. First, BTC has strongly broken through 67,000 USDT, with a 24-hour increase of 4.65%, which directly breaks the recent dull oscillation pattern and injects strong confidence into the bulls. At the same time, BlackRock's Bitcoin ETF BITA was listed today, targeting an annualized return of 15-25%. The launch of products by traditional financial giants brings incremental funds to the market and boosts long-term confidence. These two pieces of news together indicate that institutional funds are entering the market at an accelerated pace, and short-term panic sentiment is easing. But do not forget, yesterday the fear index was still around 20. Although it rose to 23 today, it is still in the extreme fear zone, and market sentiment repair requires time. Our analysis today will revolve around this turning point.
Current Price and Time
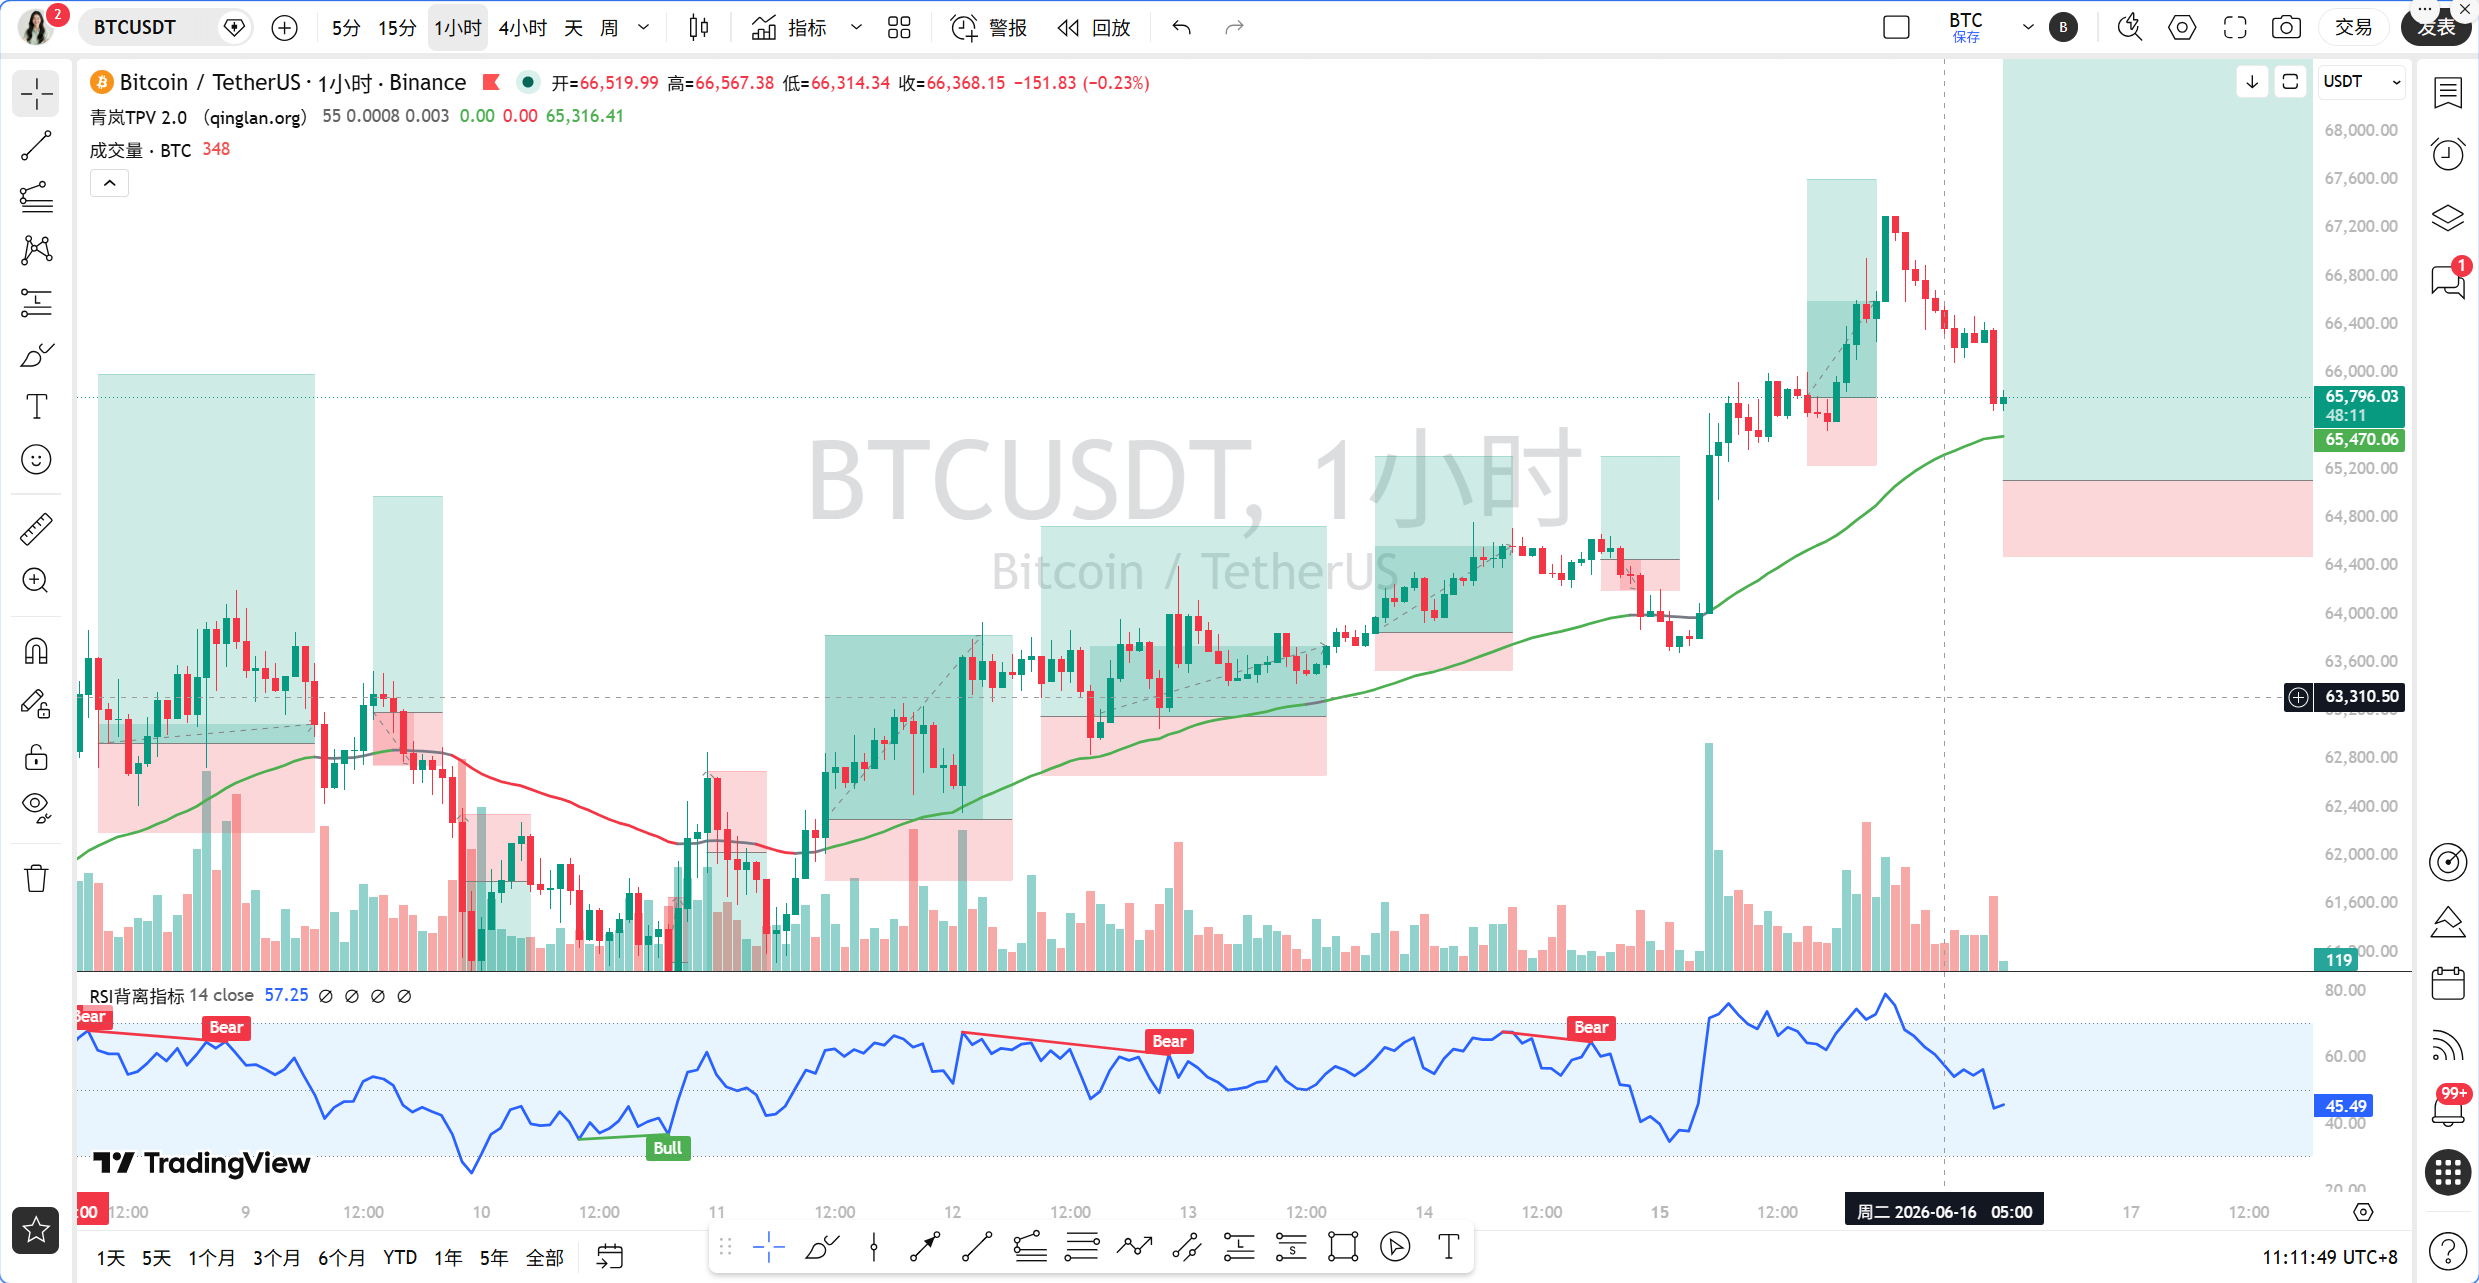
The current time is June 16, 11:10, and the BTC price is 65,793 USDT. This position is just in the pullback zone after breaking 67,000, with intense long and short battles. The 24-hour increase is 0.27%, indicating that short-term momentum has slowed down, but overall it is still in a strong zone.
Overview of Multiple Timeframes
First, let’s look at the daily chart. Daily MA5 = 65,181, MA10 = 63,919, and the current price of 65,793 has already stood above these two moving averages, with short-term moving averages beginning to turn upward. The MACD bar value is 620.83. Although the DIF and DEA are still below the zero axis, the histogram has been continuously positive, indicating that downward momentum is continuously weakening. RSI = 46.89, which has rebounded from the oversold area but has not yet entered the strong zone above 50, indicating that the daily level is at the bottom and stabilizing towards a rebound transition.
The 4-hour timeframe is more positive. MA5 = 66,452, MA10 = 65,743, the price is fluctuating near MA5, but MA30 = 64,410 provides strong support. The MACD bar value is 104.04, with DIF = 827.40 above DEA = 723.36, forming a bullish arrangement after a golden cross. RSI = 61.13, which has entered the strong zone above 50, indicating that bullish momentum is dominant at the 4-hour level.
The 1-hour timeframe is today's core observation period. MA5 = 66,091, MA10 = 66,293, and the price of 65,793 is below these two moving averages, indicating short-term downward pressure. The MACD bar value is -163.63, with DIF = 166.23 below DEA = 329.86, forming a bearish arrangement after a dead cross. RSI = 38.65, in the weak zone. But note, the 1-hour EMA55 = 65,487.68, and the current price of 65,793 is above EMA55, which indicates that the overall direction is still bullish, but there is a need for short-term adjustment.
The 15-minute period shows a weak ultra-short line. MA5 = 65,850, MA10 = 66,087, MA30 = 66,288, and the price is running below the moving averages. The MACD bar value is -49.81, with DIF = -168.15 below DEA = -118.34, RSI = 35.22, approaching the oversold area. The 15-minute level has a rebound demand, but the strength is limited.
TPV Signal Verification
Now let's use the Qinglan TPV system to verify the signals. First, observe the trend positioning. The current price is 65,793, 1-hour EMA55 = 65,487.68, and the price is above EMA55, so overall it is in the bullish trend area. But confirmation is needed to see if it holds.
Check Long Conditions. First, the price holds above 1H EMA55. In the past 8 one-hour candlesticks, the closing price was greater than EMA55 8/8 times, with 0 crossover, indicating that the price has been running above EMA55, meeting the criteria. Second, support stabilizes. The current price has pulled back from 67,000 to 65,793, gaining support near EMA55, but a clear long lower shadow or bottom formation has not yet formed, needing more confirmation. Third, the downward momentum is exhausted. Have the 1-hour MACD bars shortened for 2 consecutive cycles? The current bar value is -163.63, while the previous one was around -175, indeed shortening, but RSI = 38.65 has not rebounded from below 30, thus the exhaustion signal is incomplete. Overall, some long conditions are met, but the support shape and momentum signals are not strong enough, waiting for clearer stabilization signals.
Check Short Conditions. First, the price is under pressure below 1H EMA55. The current price is above EMA55, thus not satisfying short conditions.
Assisted data for oscillation judgment shows that in the past 8 one-hour candlesticks, the closing price was greater than EMA55 8/8 times, with 0 crossover, and the price is 0.47% away from EMA55, which does not meet the oscillation threshold. Hence, it is currently in a one-sided bullish trend, but with short-term adjustment pressure.
On-chain/Funding Situation
On-chain data shows a fear and greed index of 23, although it has recovered from 20, it is still in extreme fear. BTC market share is 56.45%, indicating that funds are still seeking refuge in Bitcoin, while altcoins perform relatively weakly. Mining company MARA has increased its holdings by 1,000 BTC, and BlackRock's ETF launch are all positive signals for capital inflow. However, the shadow of the $810 billion market cap evaporating still looms, and market confidence recovery will take time.
Key Attack and Defense Levels
The key resistance level above is at 67,000, which is the high point broken yesterday and also a psychological barrier. If it breaks through and stabilizes, the next target would look towards the 68,000-70,000 area. The key support level below is at 1-hour EMA55 = 65,487, which is the demarcation line between bulls and bears. If it breaks down, it may pull back to the 65,000 integer point, or even 64,000. The 4-hour MA30 = 64,410 is a strong support for the medium term.
Trading Thoughts
Based on the Qinglan TPV system, it is currently in a bullish trend area, but there is short-term adjustment pressure, so the trading strategy is mainly to go long at lower levels and not to chase highs.
Direction: Go Long.
Entry Conditions: Wait for the price to pull back to near 1-hour EMA55, in the range of 65,400-65,500, showing a long lower shadow or bottom formation stabilization signal, at the same time 1-hour MACD bars have shortened for 2 consecutive cycles, and RSI rebounds from around 38. Enter upon meeting conditions.
Stop-Loss Level: Set below 65,000, specifically at 64,900. If it breaks below, it indicates that the bullish trend is damaged, and it is necessary to exit the position.
Target Level: First target is 67,000, second target is 68,000. If it breaks 67,000 with volume, one may hold to see 70,000.
If the price directly breaks through 67,000, do not chase high, wait for a pullback confirmation before entering. If the price breaks below 65,400, then turn to wait and observe for new signals.
Risk Warning
The cryptocurrency market is highly volatile, and the above analysis is based on current data, not constituting investment advice. Please strictly control positions and risks.
Follow the Qinglan Crypto Classroom to seize more trading opportunities! You are welcome to visit our official website www.qinglan.org
📊 Qinglan TPV Trading Strategy Backtest Reference
🕒 Last Backtest Time 06-16 07:00:01
Total Analysis: 2278 Backtests: 1820 Accuracy: 70.5% (1284/1820)
免责声明:本文章仅代表作者个人观点,不代表本平台的立场和观点。本文章仅供信息分享,不构成对任何人的任何投资建议。用户与作者之间的任何争议,与本平台无关。如网页中刊载的文章或图片涉及侵权,请提供相关的权利证明和身份证明发送邮件到support@aicoin.com,本平台相关工作人员将会进行核查。