Original | Odaily Planet Daily ( @OdailyChina )
Author | jk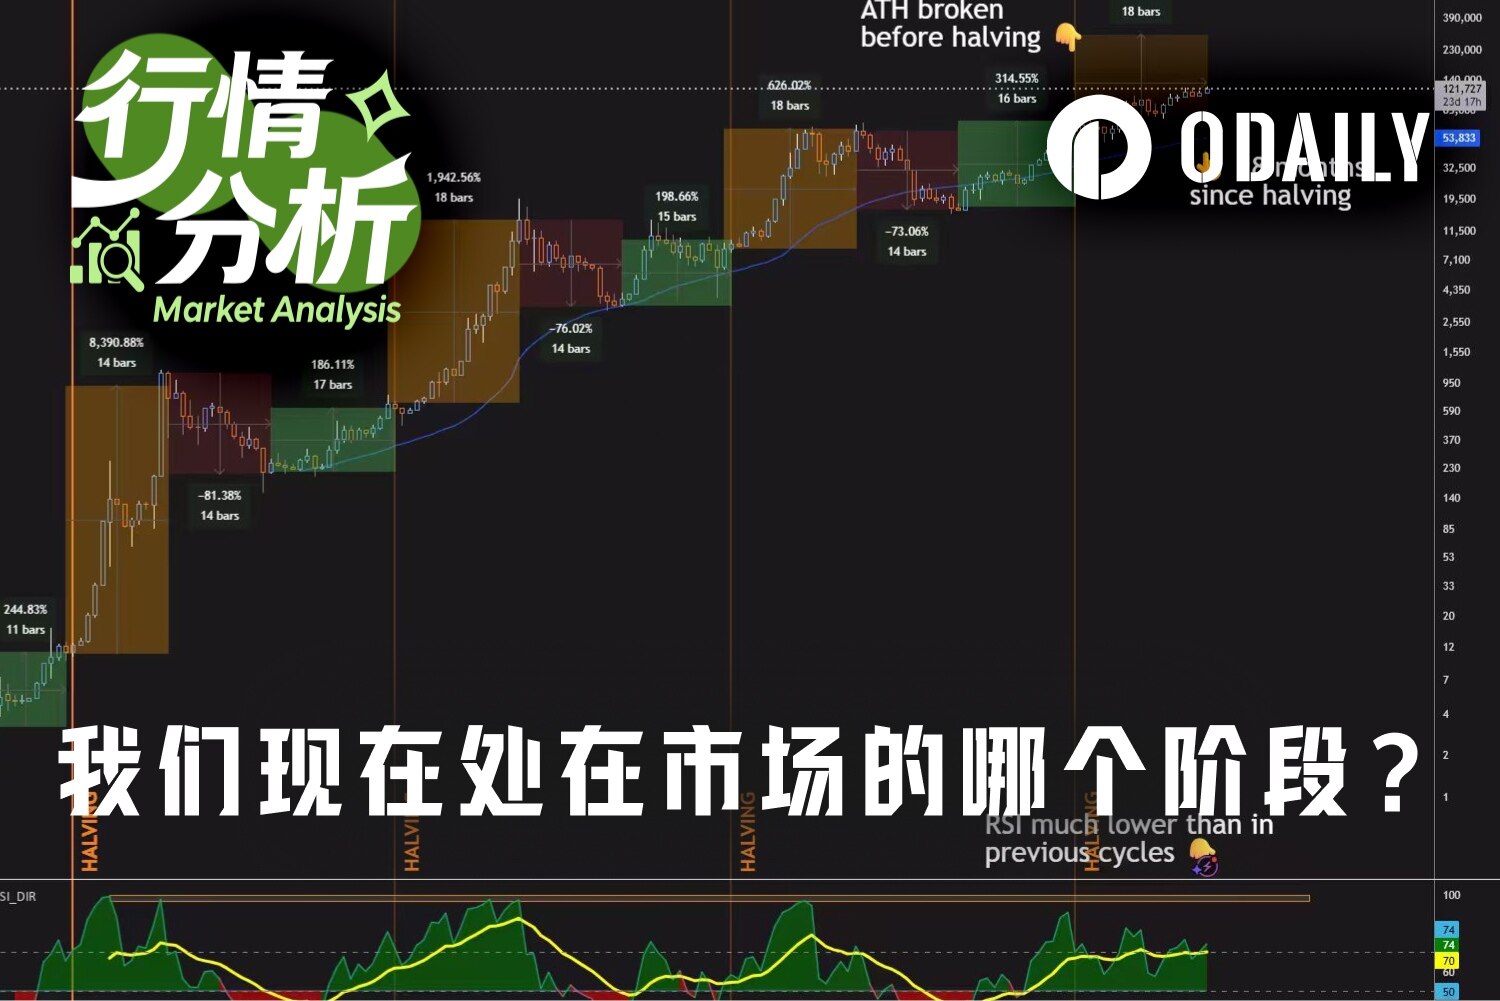
Last October, on the night BTC broke through $120,000, countless people took screenshots of the market chart and posted them in their social media circles, with captions boldly stating "Witness to History." Just eight months later, the same group of people is fixated on the price of $59,100, and the social media posts have changed to "Will it drop further?".
From the peak of $126,198 to the low of $59,100, BTC has retraced over 52%; in early June, the crypto market's Fear and Greed Index fell to 8, reaching the lowest level since 2022.
Should one enter the market now — is it a brave bottom-fishing moment, or merely taking on a passive role?
In 2018, people said BTC would ultimately go to zero; in 2022, they claimed that after the FTX collapse, the crypto industry was completely finished; by 2026, the rhetoric had changed to "the four-year cycle has failed," "institutional involvement will only lead to dumping," and "high interest rates leave risk assets with no way out." Each time, these narratives sounded most undeniable when prices were at their lowest.
However, narratives are emotional, while data is neutral. Only by separating the two can the current market's position become clear. Let's take a look together: where exactly do we stand in the BTC cycle right now?
What is the position of a 52% drop within historical cycles?
On October 6, 2025, BTC hit its historical high of $126,198. From that day until the midday low of approximately $59,100 on June 5, 2026, this retracement peak exceeded 52%.
A 52% drop sounds shocking, but compared to BTC's previous three complete bear markets, this figure is still lower than the historical average. The bear market of 2014 dropped 86% from peak to trough, while in 2018 it fell 84%, and from $69,000 to $15,479 in 2022, a decline of about 77%. The current cycle's maximum retracement of about 52% is significantly milder than the previous three.
In other words, historically, after deeper drops, BTC has always rebounded. While this statement may seem a bit assertive, from the perspective of market confidence, the current fear of the price likely exceeds the actual risk corresponding to the fundamentals.
This is also why everyone says that market confidence is more precious than gold.
Four halvings, three nearly identical curves
Understanding the current position cannot avoid the framework of the halving cycle.
BTC halves approximately every four years, reducing the miners' block reward and shrinking new supply. Historically, the last three cycles showed remarkably similar bull and bear rhythms: a peak occurrence 12 to 18 months after halving, a trough 12 to 14 months after the peak, and the bottom typically appearing about 17 months before the next halving.
- In the first round, the halving in November 2012 occurred when BTC was only $12. About 12 months later, in November 2013, the price rose to a peak of $1,150. The subsequent bear market lasted about 13 months, touching a low of around $160 in January 2015, while that bottom was about 18 months away from the next halving (July 2016).
- In the second round, the halving in July 2016 occurred when BTC was around $650. About 17 months later, in December 2017, the price peaked at $19,800. A bear market of approximately 12 months followed, dropping to a low of about $3,200 in December 2018, with that bottom 17 months away from the next halving (May 2020).
- In the third round, the halving in May 2020 occurred when BTC was around $8,600. About 18 months later, in November 2021, the price peaked at $69,000. A bear market lasting about 13 months followed, reaching a low of approximately $15,500 in November 2022 when FTX collapsed, with that low 17 months away from the next halving (April 2024).
- We are now in the fourth round. The halving on April 19, 2024, will reduce the block reward from 6.25 to 3.125 BTC, with a halving price approximately $63,000. Subsequently, about 18 months later, BTC is expected to peak at $126,198 on October 6, 2025, fully falling within the historical "12 to 18 months peak" window.
As of June 2026, approximately 26 months have passed since the 2024 halving, and about 8 months since the October 2025 peak. According to historical patterns, the bottom usually takes 12 to 14 months to reach after a peak, suggesting that the bottom window may fall around October 2026, coincidentally about 17 months before the next halving (April 2028), almost perfectly aligning with the previous three cycles.
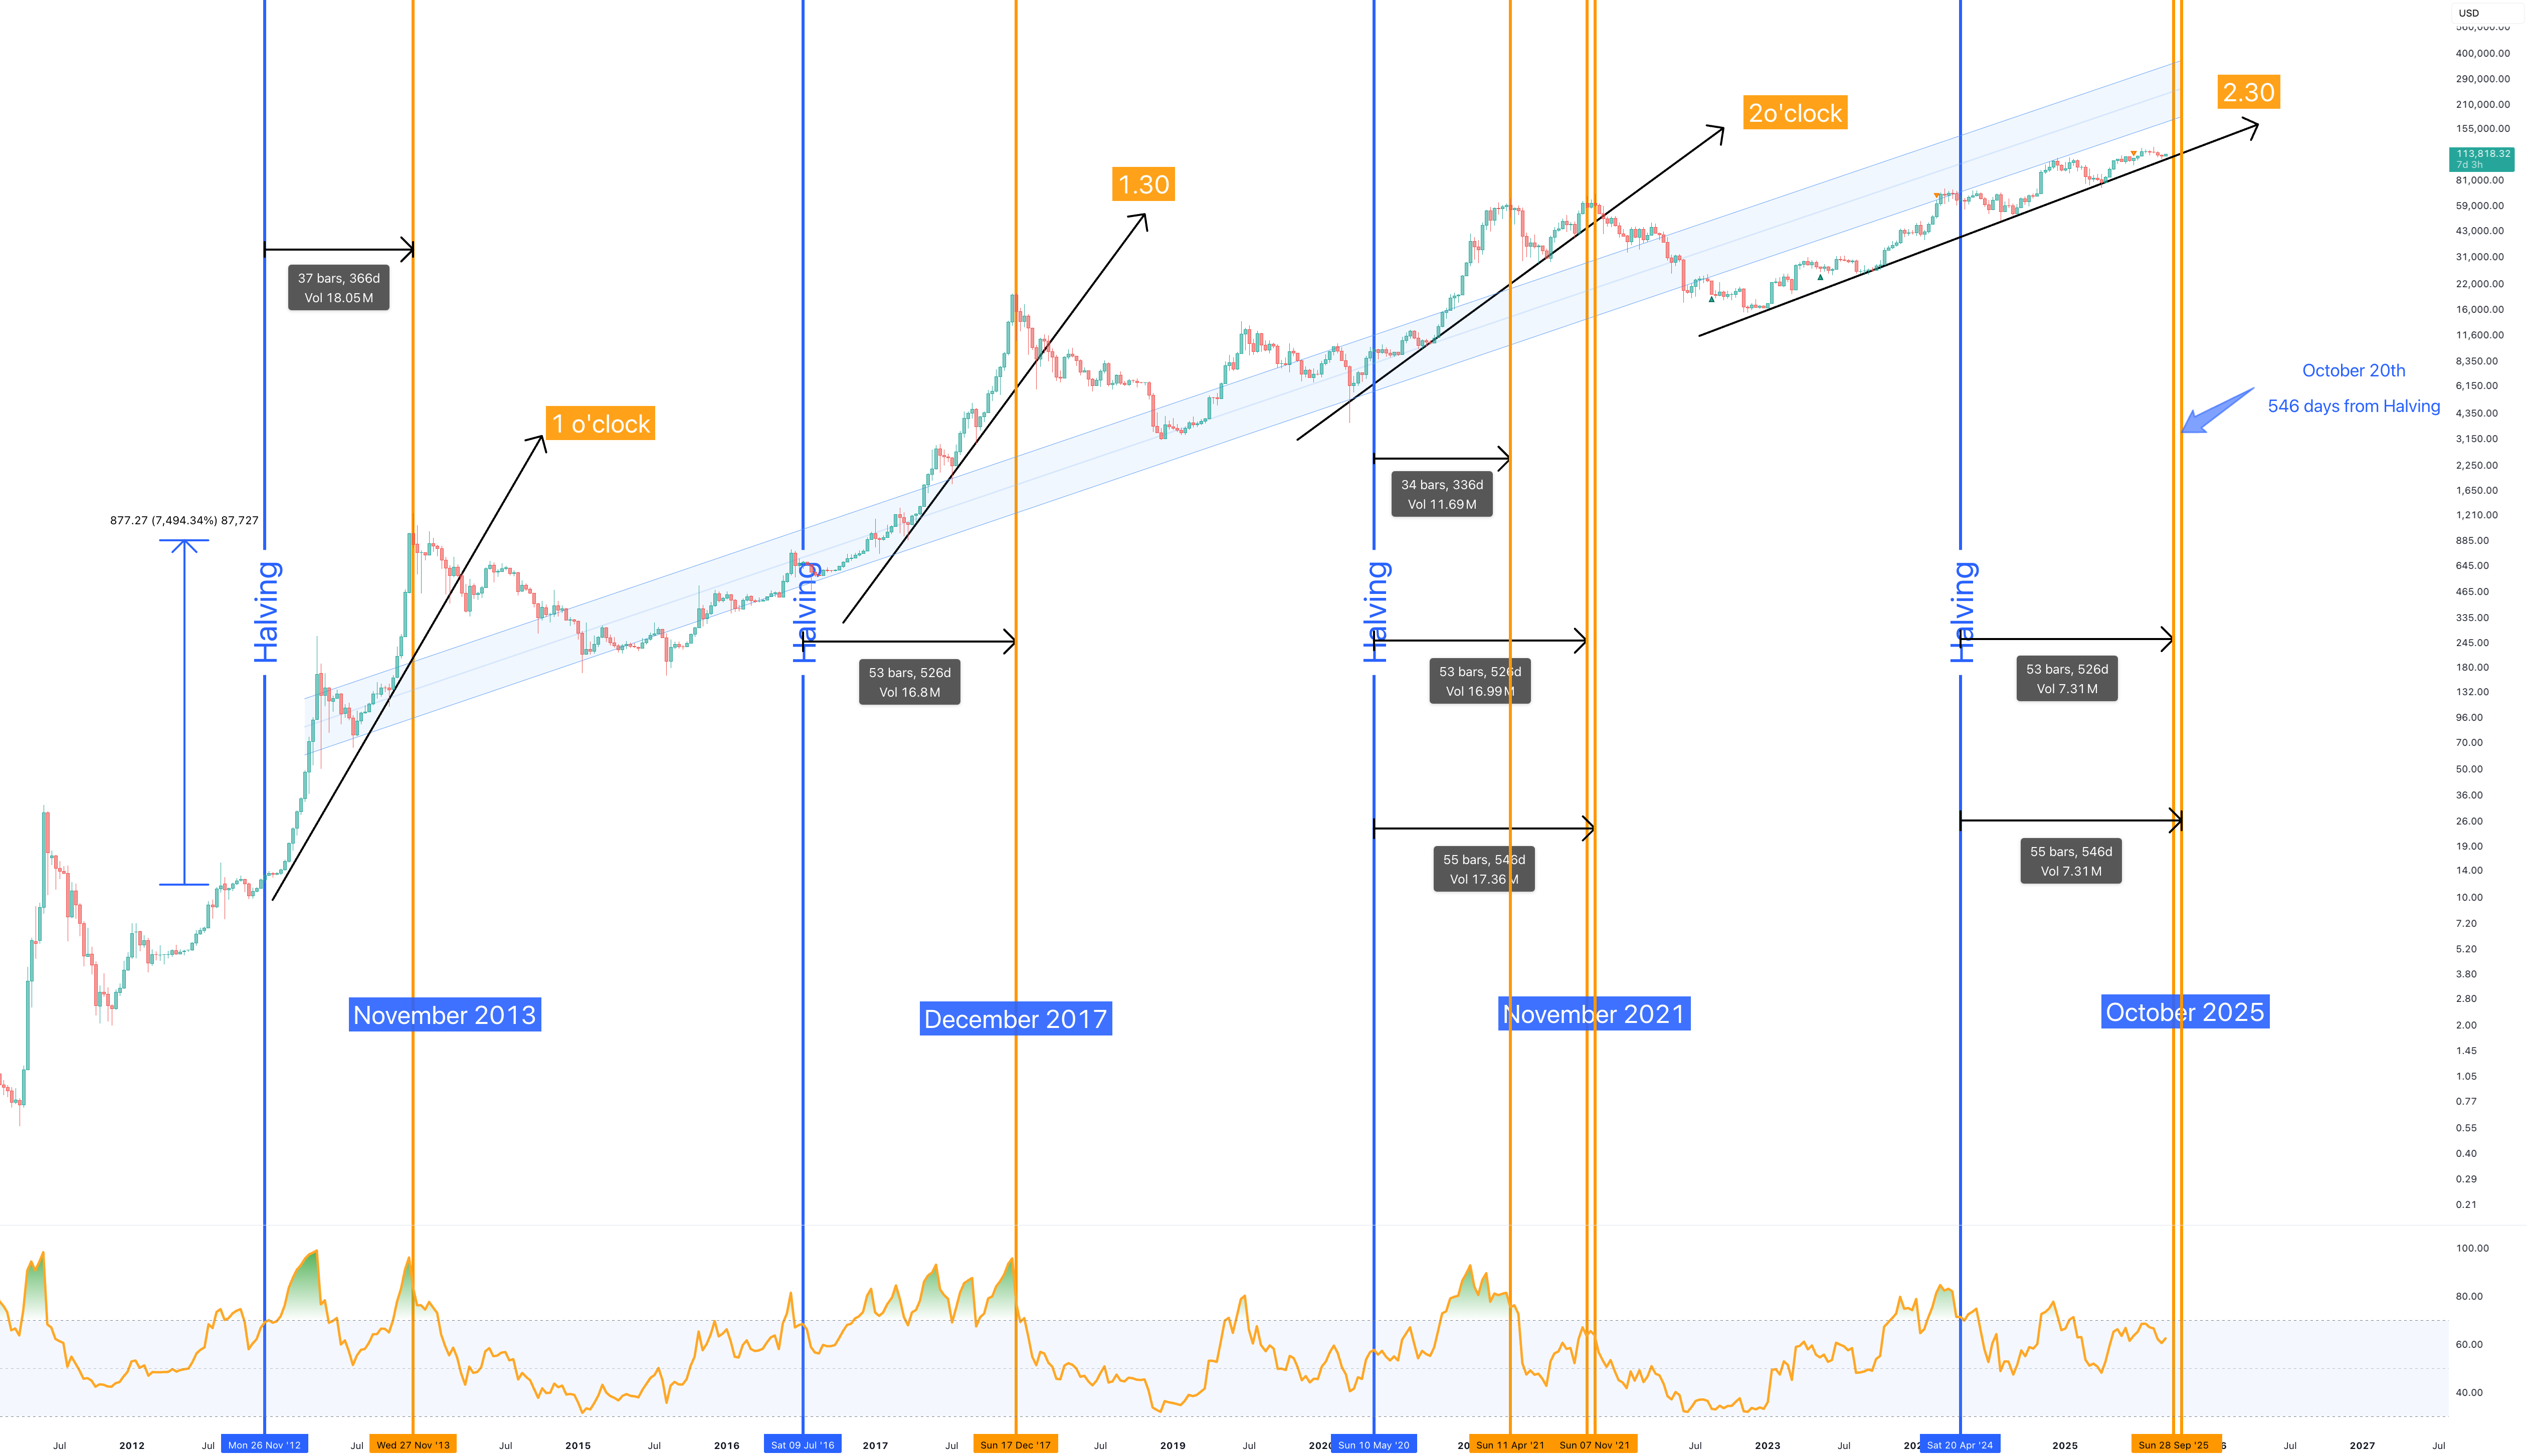
BTC halving timeline
From the current point of view, the second half of 2026 appears to be a stage in this cycle that warrants a reassessment of the risk-reward ratio, rather than a mere phase of panic selling.
The supply contraction post-halving continues, and the long-term buying power from spot ETFs and institutional investments has altered BTC's previously retail sentiment-driven market structure. If historical cycles continue to hold, the fourth quarter of 2026 may indeed be a key window for the market to transition from pessimism to recovery, and from deleveraging to reaccumulation. For investors optimistic about BTC's long-term value, short-term corrections might actually present attractive opportunities for staggered entry. As the bottom range approaches, market confidence could be expected to solidify again, and the foundation for the next upward cycle may quietly form during this stage.
On-chain data: Three simultaneously lit low signals
Beyond price charts, on-chain data provides deeper valuation references.
- Indicator 1: MVRV Z-Score, this indicator measures the deviation between the current market price and the average holding cost of all network holders. Historically, a Z-Score above 7 indicates severe market overvaluation, nearing a peak; while dropping to around 0 or even negative corresponds to a deeply undervalued region. When BTC peaked in October 2025, the Z-Score was around 5 to 6. According to MacroMicro's data on June 9, the current Z-Score is about 0.27, nearing the boundary of historical bottom regions.
- Indicator 2: The realized price for the entire network, this represents the cost basis for all circulating BTC weighted by their last on-chain movement price. CryptoQuant's research director Julio Moreno noted on June 10 that this value is currently around $53,600. Based on the current market price of $62,000, the market price is only about 9% higher than the entire network cost — this premium is extremely rare historically. In previous cycles, significant bottoms formed near or just below the realized price, which briefly fell below that in November 2022.
- Indicator 3: The 200-week moving average. This moving average represents the average price over the past nearly four years, currently around $62,200. On June 4, 2026, BTC touched this line for the first time in this cycle. In 2015, 2018, and 2020, the three bear market bottoms all precisely occurred near this line. 2022 was the only exception, where prices broke through the moving average and stayed below for about 16 months, ultimately ending with the FTX collapse.
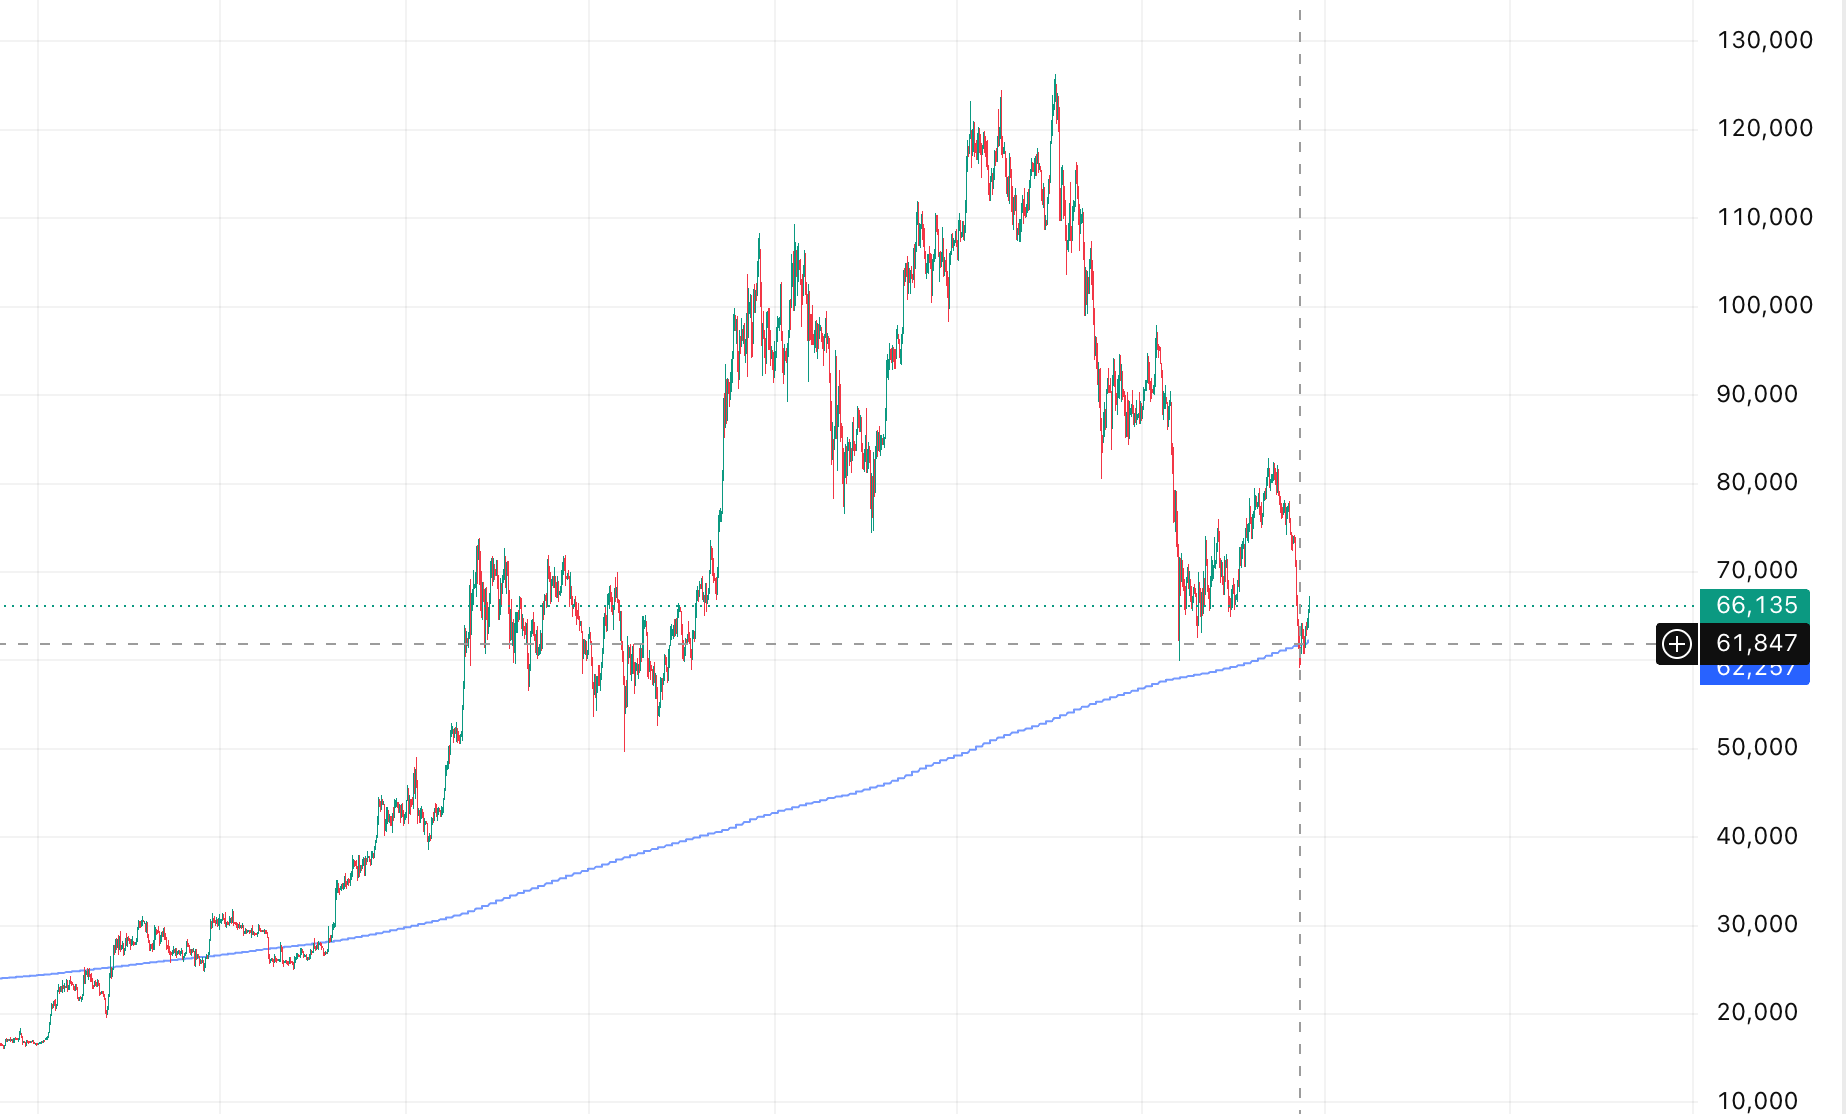
200-week moving average price. Source: TradingView
Funds: Retail exits, whales enter
Aside from low signals on the valuation front, the structure of capital flow has also exhibited some bottom characteristics.
On the ETF front, from mid-May to early June, the US spot BTC ETF experienced net outflows for 13 consecutive trading days, totaling about $4.4 billion, equivalent to approximately 59,400 BTC, marking the longest single outflow since the ETF's inception. BlackRock's IBIT experienced outflows of about $980 million in a single week, setting a new record for the worst single-week performance in history. This reflects panic redemption from short-term funds and retail investors.
Meanwhile, opposite movements have appeared on-chain. The number of whale addresses holding over 100 BTC reached a new high in 2026, totaling around 20,229, and the net buying amount by whales in the first five months of 2026 already equals the total for all of 2025. Strategy sold 32 BTC at the end of May to pay preferred stock dividends, marking its first sale in four years, raising market concerns about a shift in strategy. However, two weeks later, on June 8, the company purchased 1,550 BTC at an average price of $65,332, increasing its total holding to 845,256 BTC, which Michael Saylor described as "a good time to increase positions."
On the exchange front, the BTC balances across major exchanges have continued to decline over the past few months, with chips flowing from the market to long-term holders and institutional cold wallets. Currently, long-term holders who have held for over 155 days control about 78% of the circulating supply, one of the highest ratios in history.
Macro: The greatest uncertainty has just been halved
The core macro logic restraining BTC over the past few months mainly stems from two lines: high interest rates and the Iran war.
At the beginning of 2026, the US and Israel launched military strikes against Iran, leading to a partial blockade of the Strait of Hormuz. The IEA characterized this as the largest supply disruption in global oil market history, causing international oil prices to surge to $105 to $120 per barrel. Inflation rebounded as a result, with the US May CPI rising to 4.2%, far exceeding the 2% policy target. The federal funds rate was forced to remain unchanged in the 3.50% to 3.75% range, with the market at one point pricing a 79% probability of "no rate cuts" in 2026, causing the dollar index to strengthen to around 99 to 100. The dual pressures of high interest rates and risk aversion have meant that, even as global liquidity continued to expand, it was slow to flow into the crypto market.
However, on the night of June 14, US President Trump announced that the US-Iran deal had been completed, and the Iranian Supreme National Security Council subsequently issued a statement early on June 15 confirming that a ceasefire agreement had been reached, with an official signing ceremony scheduled for June 19 in Switzerland, leading to the reopening of the Strait of Hormuz.
The market reaction was immediate and severe. WTI crude oil fell more than 4% to about $80.25 per barrel that day, while Brent crude dropped to around $83.51. BTC surged from around $61,500 before the announcement of the agreement to above $65,000, with a single-day increase of over 5%, marking the largest single-day rebound in three months, accompanied by an increase in trading volume. The three major US stock indices' futures rose over 300 points, and Asian stock markets also experienced upward movement.
Deutsche Bank noted after the agreement's completion that the risk of a short-term Fed rate hike is likely to diminish, but due to persistent inflation, the resilience of the labor market, and the neutral rate potentially being higher than expected, there remains a possibility of rate hikes in 2027. The specific situation regarding the Fed will depend on the debut performance of the new appointee, Waller.
Conclusion: It's both the bottom and the time of least confidence
When BTC is above $120,000, everyone is willing to believe it will go higher; but when it falls back to around $60,000, and on-chain valuations, cycle positions, the proportion of long-term holders, and macro variables all point towards bottom regions, the market ironically suffers from a lack of confidence.
Investment is never completed during the most comfortable emotional moments. Every major BTC bottom in history has been accompanied by skepticism that "this time is different," along with comprehensive doubt regarding the industry, cycle, and the asset itself. The difference lies in whether some view this skepticism as a reason to exit, while others see it as an opportunity to reprice the risk-reward ratio.
The current BTC certainly does not mean it won't fall further, nor does it indicate that this is the ultimate bottom. However, if we extend the timeframe and separate short-term panic from long-term structure, the current region is no longer suitable to define as "buying high," but rather more akin to a necessary window for patiently, disciplined, and confidently entering in stages.
Market confidence is a precious asset, even more valuable than gold. Because gold can only hedge against inflation, while confidence can transcend cycles. For those who still believe in BTC's long-term value, trust in its scarcity, and faith that global liquidity will eventually return to risk assets, the most important question in the second half of 2026 might not be "Will it drop further?" but rather, when the market regains its belief, will you already be involved?
What will you choose?
免责声明:本文章仅代表作者个人观点,不代表本平台的立场和观点。本文章仅供信息分享,不构成对任何人的任何投资建议。用户与作者之间的任何争议,与本平台无关。如网页中刊载的文章或图片涉及侵权,请提供相关的权利证明和身份证明发送邮件到support@aicoin.com,本平台相关工作人员将会进行核查。


