Yesterday, I predicted that the stock market daily line would stabilize.
A double bottom formed.
Let's take a look today.
The big coin has risen above 64,000,
approaching 66,000.
Currently, the middle track of the daily line is still a pressure point.
Unless a big bullish candle directly breaks through,
because the MACD,
let's take a look,
has already successfully crossed on the daily line.
So where should the market go from here?
We will explain it in real-time.
Hello everyone, I am Brother Yun.
Today is June 15, 2026, Beijing time.
It's Monday, let's look at the weekly line.
The weekly line changing is not particularly great,
right, it's not particularly good.
Of course, let's not care for now.
Since it wants to surge,
it's likely to make a wave, right?
After the resistance level is broken,
it can continue to pull back.
Let's take a look at the weekly level.
Currently, the weekly level
has formed a vertical line,
which is quite good.
The next resistance is likely to be between 68,000 and 70,000.
If anyone wants to short,
you can do so at 68,000 to 70,000.
For now, since it hasn't broken 64,000,
it's best to hold off entering.
Entering too early can lead to losses.
The daily line is near the middle track,
which is exactly 66,600.
Everyone can pay attention to
66,600 to see if it can break through effectively.
If it breaks through,
it can continue to attack,
going up to 70,000 or 75,000.
If it doesn't break through,
it will continue to retrace
to 63,000 to 60,000.
Now let's look at the 4-hour chart.
The 4-hour big bullish candle has broken through the upper track.
A pullback to the upper track is an opportunity.
Of course, if you feel that
this 4-hour is a bit high and you don’t want to chase,
entering here feels
somewhat risky.
At this time,
we can refer to the 15-minute chart,
waiting for the 15-minute chart to approach the lower track,
then enter the trade,
or enter again when near the middle track.
This way is more scientific,
and the stop-loss space is also smaller.
This is called looking big and doing small.
Everyone can use it as a reference.
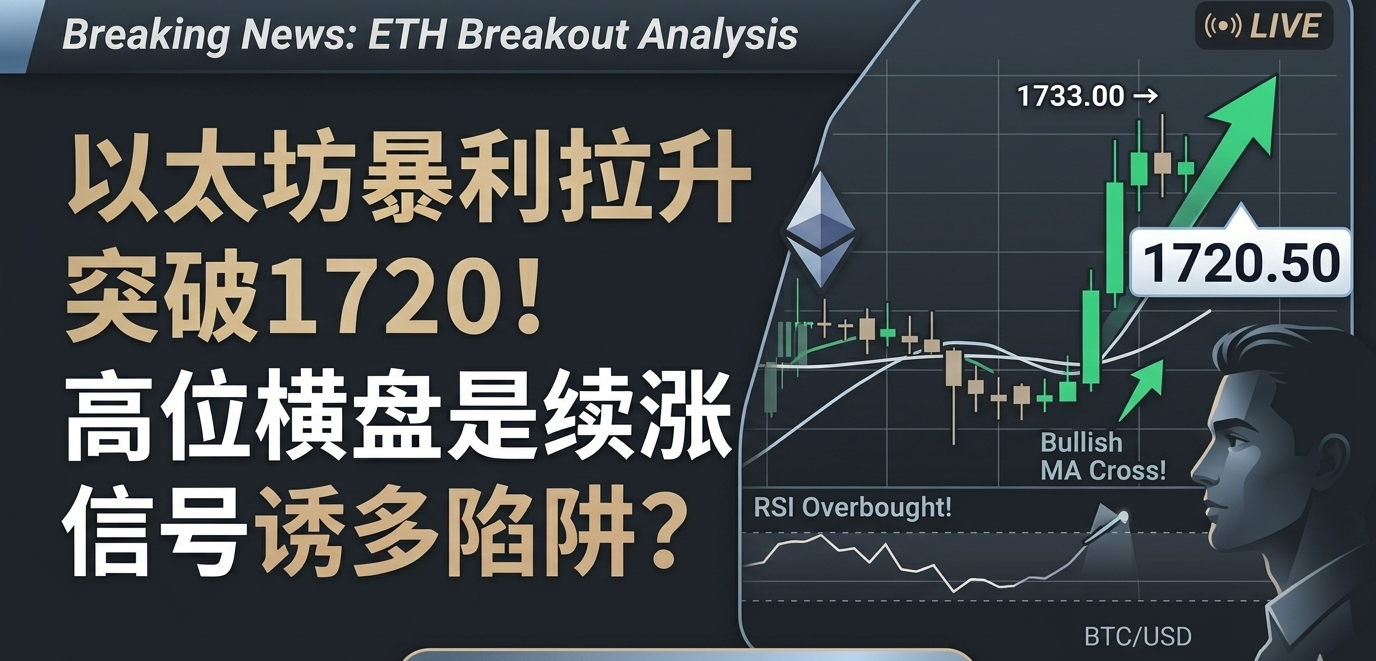
As for Ethereum,
the 15-minute chart
has also formed a straight line,
with resistance around 173,230.
Currently, as long as it holds above 1,700,
we can still consider entering.
No problem.
In the 4-hour view,
it has also broken through the upper track.
It is holding near the upper track.
The middle track is 1,670,
which is our defense position.
If it breaks below,
it will continue to retrace.
On the daily chart,
1,800 is a strong resistance.
Everyone should pay special attention to this level.
Overall, Ethereum is still slightly weaker,
not like the big bullish candle of Bitcoin.
The weekly line closed above the lower track,
which is a good sign.
However, the MACD is still in a death cross.
The weekly MACD is still in a death cross.
Unless it turns around,
otherwise, it still needs to retrace.
However, the KDJ has crossed bullishly.
The KDJ has crossed bullishly.
So, we can't observe the weekly line well.
The MACD secondary indicator is difficult to interpret
since one is in a death cross and the other is in a bullish cross.
They essentially indicate that it will move in a range.
As mentioned earlier about a space,
everyone can take note.
Personally, I believe after this wave of washing, it will surge again.
And gold, too,
gold will surge as well.
I mentioned this to everyone earlier,
4,400 and 4,500.
Please pay attention.
So today's market update ends here for now.
This week,
the first three days will likely continue to rise,
and only then will it start to retrace.
Therefore, those trapped in short positions,
you need to hold on until Friday
before you can possibly break even.
Wishing everyone a new week,
a new journey.
We'll see you tomorrow, goodbye.
免责声明:本文章仅代表作者个人观点,不代表本平台的立场和观点。本文章仅供信息分享,不构成对任何人的任何投资建议。用户与作者之间的任何争议,与本平台无关。如网页中刊载的文章或图片涉及侵权,请提供相关的权利证明和身份证明发送邮件到support@aicoin.com,本平台相关工作人员将会进行核查。