1. Today's Core Events (June 15)
1. Geopolitical Risks Ease, Leading to Market Recovery
The U.S. and Iran reached a temporary peace agreement, and the Strait of Hormuz resumed navigation, leading to a quick decline in safe-haven sentiment in the Middle East, causing a global rally in risk assets, which directly catalyzed the rebound in the crypto market from last week's low.
2. $339 million in liquidations in 24 hours, leading to concentrated short squeezes
According to CoinGlass data, over 102,700 traders were liquidated globally in the past 24 hours, amounting to $339 million; of this, short liquidations accounted for $248 million, making up over 73%. The current rebound has concentrated on clearing out shorts that bet on declines, with the largest single liquidation being a $6.1065 million position on the Binance platform for BTC-USDT.
3. Divergence in ETF Fund Flows Intensifies
• The BTC spot ETF recorded a net inflow of $86 million on the day, with institutional funds showing clear signs of bottom-fishing around the $60,000 level;
• The ETH spot ETF experienced net outflows for five consecutive weeks, with a net outflow of $14.9072 million last week, as institutional enthusiasm for Ethereum continues to weaken.
4. Macro Key Nodes Approaching
On June 18 at 2:00 AM Beijing time, the Fed will announce its June FOMC decision (Chairman Waller's debut), and the market is currently pricing in over 98% probability of maintaining the interest rate; major expectations predict a downward adjustment in the dot plot for interest rate cuts by 2026, with the first rate cut expected to be pushed back to 2027. The high-interest environment continues to suppress the valuation of risk assets.
5. Market Sentiment Remains in an Extreme Fear Zone
The cryptocurrency fear and greed index is at 20, still in the "extreme fear" zone, but has seen significant improvement from last week's low of 8, with market sentiment warming up from the bottom.
2. Impact of Events on the Market
1. Short-term: Exhaustion of Negative Factors Brings About a Recovery Bounce
The easing of geopolitical conflicts in the Middle East combined with concentrated short liquidations has led to a quick clearing of leverage in the market, alleviating short-term selling pressure and driving a broad-based rally.
2. Mid-term: Macro Suppression Remains, Limits Rebound Potential
High interest rate expectations are currently the core suppressive factor in the market. If this FOMC confirms no rate cuts for the year, it will continue to suppress the space for valuation recovery, making it likely for the market to maintain a range-bound pattern, difficult to initiate a trend upward directly.
3. Sector: BTC and ETH Strength Differentiation Continues
The flow of ETF funds directly reflects institutional preferences, with BTC's value storage properties being more recognized by institutions, while ETH continues to be reduced as funding due to weakened ecosystem narratives and lower-than-expected application landing, making it difficult to change the mid-term differentiation pattern.
Bitcoin (BTC)
1. Multi-Cycle Technical Analysis
• Daily Level (Mid-term Trend)
Overall in the recovery bounce phase of a declining trend, the price still operates below the 30-day line ($70,600) and the 200-day line ($77,800), with the moving average system in a bearish arrangement, and the mid-term decline structure has not reversed.
◦ RSI value is 34, still at the edge of the oversold range, with the downward momentum marginally weakening, but no bottom divergence has appeared, making the sustainability of the rebound questionable;
◦ MACD green bars continue to narrow, with expectations of a low-level golden cross, but a golden cross below the zero axis is defined only as a bounce, not a trend reversal;
◦ Daily trading volume is 28% lower than the 30-day average, indicating insufficient confidence from bottom-fishing funds, with the rebound lacking volume support.
• 4-Hour Level (Short-term Trend)
Forming a double-bottom rebound pattern, the price stabilizes on the short-term upward trend line, with a short-term bullish advantage but slowing upward momentum.
◦ Price is above the 100-period moving average, with short-term support moving up to $64,500;
◦ RSI has risen to 52, entering a neutral to bullish zone, not yet overbought;
◦ MACD operates above the zero axis, but the red bars are starting to shorten, with a short-term need for a pullback confirmation.
2. Key Support/Resistance Levels
Level Support Level (USD) Resistance Level (USD)
First (Intraday) $64,200-64,600 (short-term trend line + 50% Fibonacci retracement) $66,200-66,500 (intraday high + short-term selling pressure area)
Second (Short-term) $63,000-63,500 (7-day line + previous oscillation low point) $67,000-67,200 (previous oscillation platform lower edge)
Third (Strong Key) $60,000 (psychological level + strong structural support) $69,000-70,600 (gap filling position + 30-day line)
3. Corresponding Operational Strategies
• Short-term Contracts
◦ Low-buy Strategy: Wait for stabilization in the $64,300-64,800 range to enter a light long position, stop loss at $63,800, targets sequentially at $66,200, and $67,000;
◦ High-sell Strategy: If a rebound meets resistance in the $66,800-67,200 range, enter short, stop loss at $67,800, targets sequentially at $65,000 and $64,000;
◦ Core Principle: Avoid chasing highs and cutting losses, high sell and low buy within the range, strictly control positions before the FOMC decision.
• Mid-line Spot
◦ Left-side Layout: Gradually build the first tier of positions in the $60,000-62,000 range, adding once for every 5% drop, total position not exceeding 30% of total funds;
◦ Right-side Confirmation: Add positions after stabilizing above $71,000 (breaking above the 30-day line + downward trend line) to confirm trend reversal;
◦ Stop-loss Reference: If effectively falling below the structural support of $56,000, it indicates a continuation of the downward trend, pause left-side layout.
2. Ethereum (ETH)
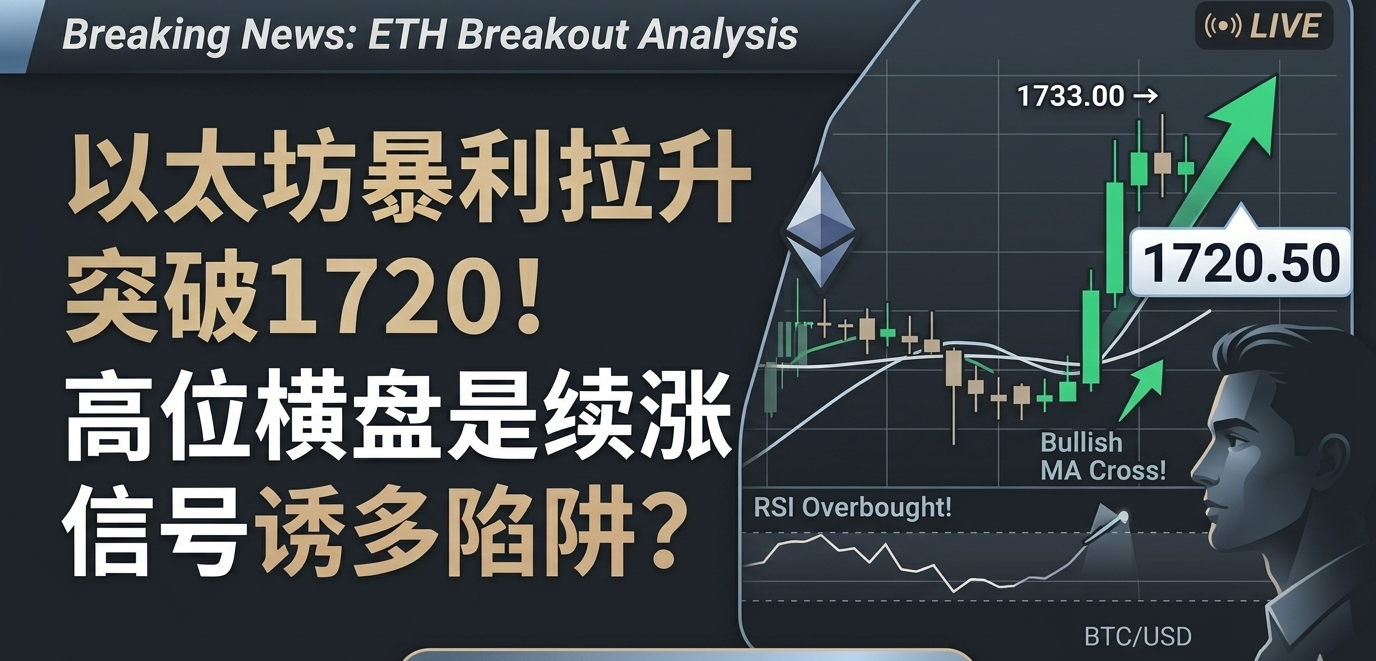
Current Price Reference: $1,720
1. Multi-Cycle Technical Analysis
• Daily Level (Mid-term Trend)
Performance significantly weaker than BTC, within a clear descending channel, with the 15, 30, and 60-day lines all repressing the price, highlighting a more prominent mid-term bearish trend.
◦ RSI value is 37, slightly repairing after being oversold, still within a weak zone;
◦ MACD has a low-level golden cross but operates below the zero axis, with weak rebound signals and no clear bottoming signals;
◦ ETF funds continue to flow out, lacking fundamental catalysts, which inherently limits the height of rebounds.
• 4-Hour Level (Short-term Trend)
After stabilizing from declines, it follows the market rebound, short-term moving averages have turned upward, showing signs of gradual bottoming, but have not yet broken through the upper boundary of the descending channel.
◦ Price is above the 100-period moving average, with short-term support moving up to $1,665;
◦ RSI has risen to 47, with a balance of bullish and bearish forces;
◦ The Fibonacci 23.6% rebound level at $1,730 is strong resistance, only an effective breakout can open up upside space.
2. Key Support/Resistance Levels
Level Support Level (USD) Resistance Level (USD)
First (Intraday) $1,665-1,670 (short-term trend line + 50-day line) $1,730-1,745 (intraday high + 15-day line)
Second (Short-term) $1,620-1,650 (previous oscillation low point) $1,800 (psychological level + lower edge of descending channel)
Third (Strong Key) $1,500-1,550 (previous low point + structural support) $1,920-1,960 (30-day line + 50-day line)
3. Corresponding Operational Strategies
• Short-term Contracts (1-3 days, position ≤ 15%)
◦ Low-buy Strategy: If stabilizing in the $1,660-1,680 range, enter a light long position, stop loss at $1,630, targets sequentially at $1,730 and $1,780;
◦ High-sell Strategy: If a rebound meets resistance in the $1,780-1,800 range, enter short, stop loss at $1,830, targets sequentially at $1,700 and $1,650;
◦ Core Principle: Price elasticity is weaker than BTC, profits should be taken timely to avoid passive holding.
• Mid-line Spot (1-3 months, position ≤ 15%)
◦ Left-side Layout: Gradually build small positions in the $1,500-1,550 range, with total positions not exceeding 15% of total funds, priority allocation far below BTC;
◦ Right-side Confirmation: Add positions after stabilizing above the $2,000 psychological level and when ETF funds turn from outflow to inflow;
◦ Risk Warning: If falling effectively below $1,500, the downside space will open further, needing timely stop loss to exit.
Risk Warning: The above analysis does not constitute investment advice, the June 18 FOMC decision is a core risk point, policy exceeding expectations in a hawkish direction may break the current range, and position management should be done properly.
[Inviting you to join the crypto circle communication group]
Scan the code to join Safew

免责声明:本文章仅代表作者个人观点,不代表本平台的立场和观点。本文章仅供信息分享,不构成对任何人的任何投资建议。用户与作者之间的任何争议,与本平台无关。如网页中刊载的文章或图片涉及侵权,请提供相关的权利证明和身份证明发送邮件到support@aicoin.com,本平台相关工作人员将会进行核查。