Dear friends, I am Qinglan. Today, the market sentiment has clearly warmed up, and there are two significant events in the news worth noting. First, a US-Iran agreement has been reached, causing Bitcoin to surge by 2.48%. The alleviation of geopolitical risks directly boosted the sentiment towards risk assets, providing strong support for BTC in the short term. Second, MicroStrategy's founder has once again signaled for Bitcoin, suggesting that additional purchases may be disclosed next week, which is a clear indication of the institutions' continued bullish outlook. These two pieces of news combined have injected bullish momentum into the current market, but we also need to calmly analyze the real state of the technical indicators.
Current Price and Time
Current time is June 15th, 10:32, with the BTC price standing at 65616 USDT. The 24-hour increase is approximately 2%, and the Fear and Greed Index is only 18, indicating an extreme fear zone, which suggests that market sentiment remains cautious. However, the price has withdrawn from the lows, opening up space for sentiment recovery.
Overview of Multi-Cycle Status
On the daily timeframe, MA5 = 64605, MA10 = 63357, MA30 = 69966. The MACD's DIF = -2894.18, DEA = -3359.27, and the histogram is 465.09. Although the DIF remains below the zero axis, the histogram has been consistently positive, indicating that downward momentum is continuously waning. RSI = 34.95, on the edge of the oversold region, showing a demand for a rebound. Overall, the daily chart is still in a bearish trend, but a bottom structure is forming, and bullish momentum is accumulating.
On the 4-hour timeframe, MA5 = 64747, MA10 = 64576, MA30 = 63519. The MACD's DIF = 547.84, DEA = 430.40, and the histogram is 117.44. Both the DIF and DEA are above the zero axis, with the histogram remaining positive; bullish momentum is strong. RSI = 74.59, close to the overbought area, but not at extreme levels, still allowing for upward space. The 4-hour trend is clearly bullish.
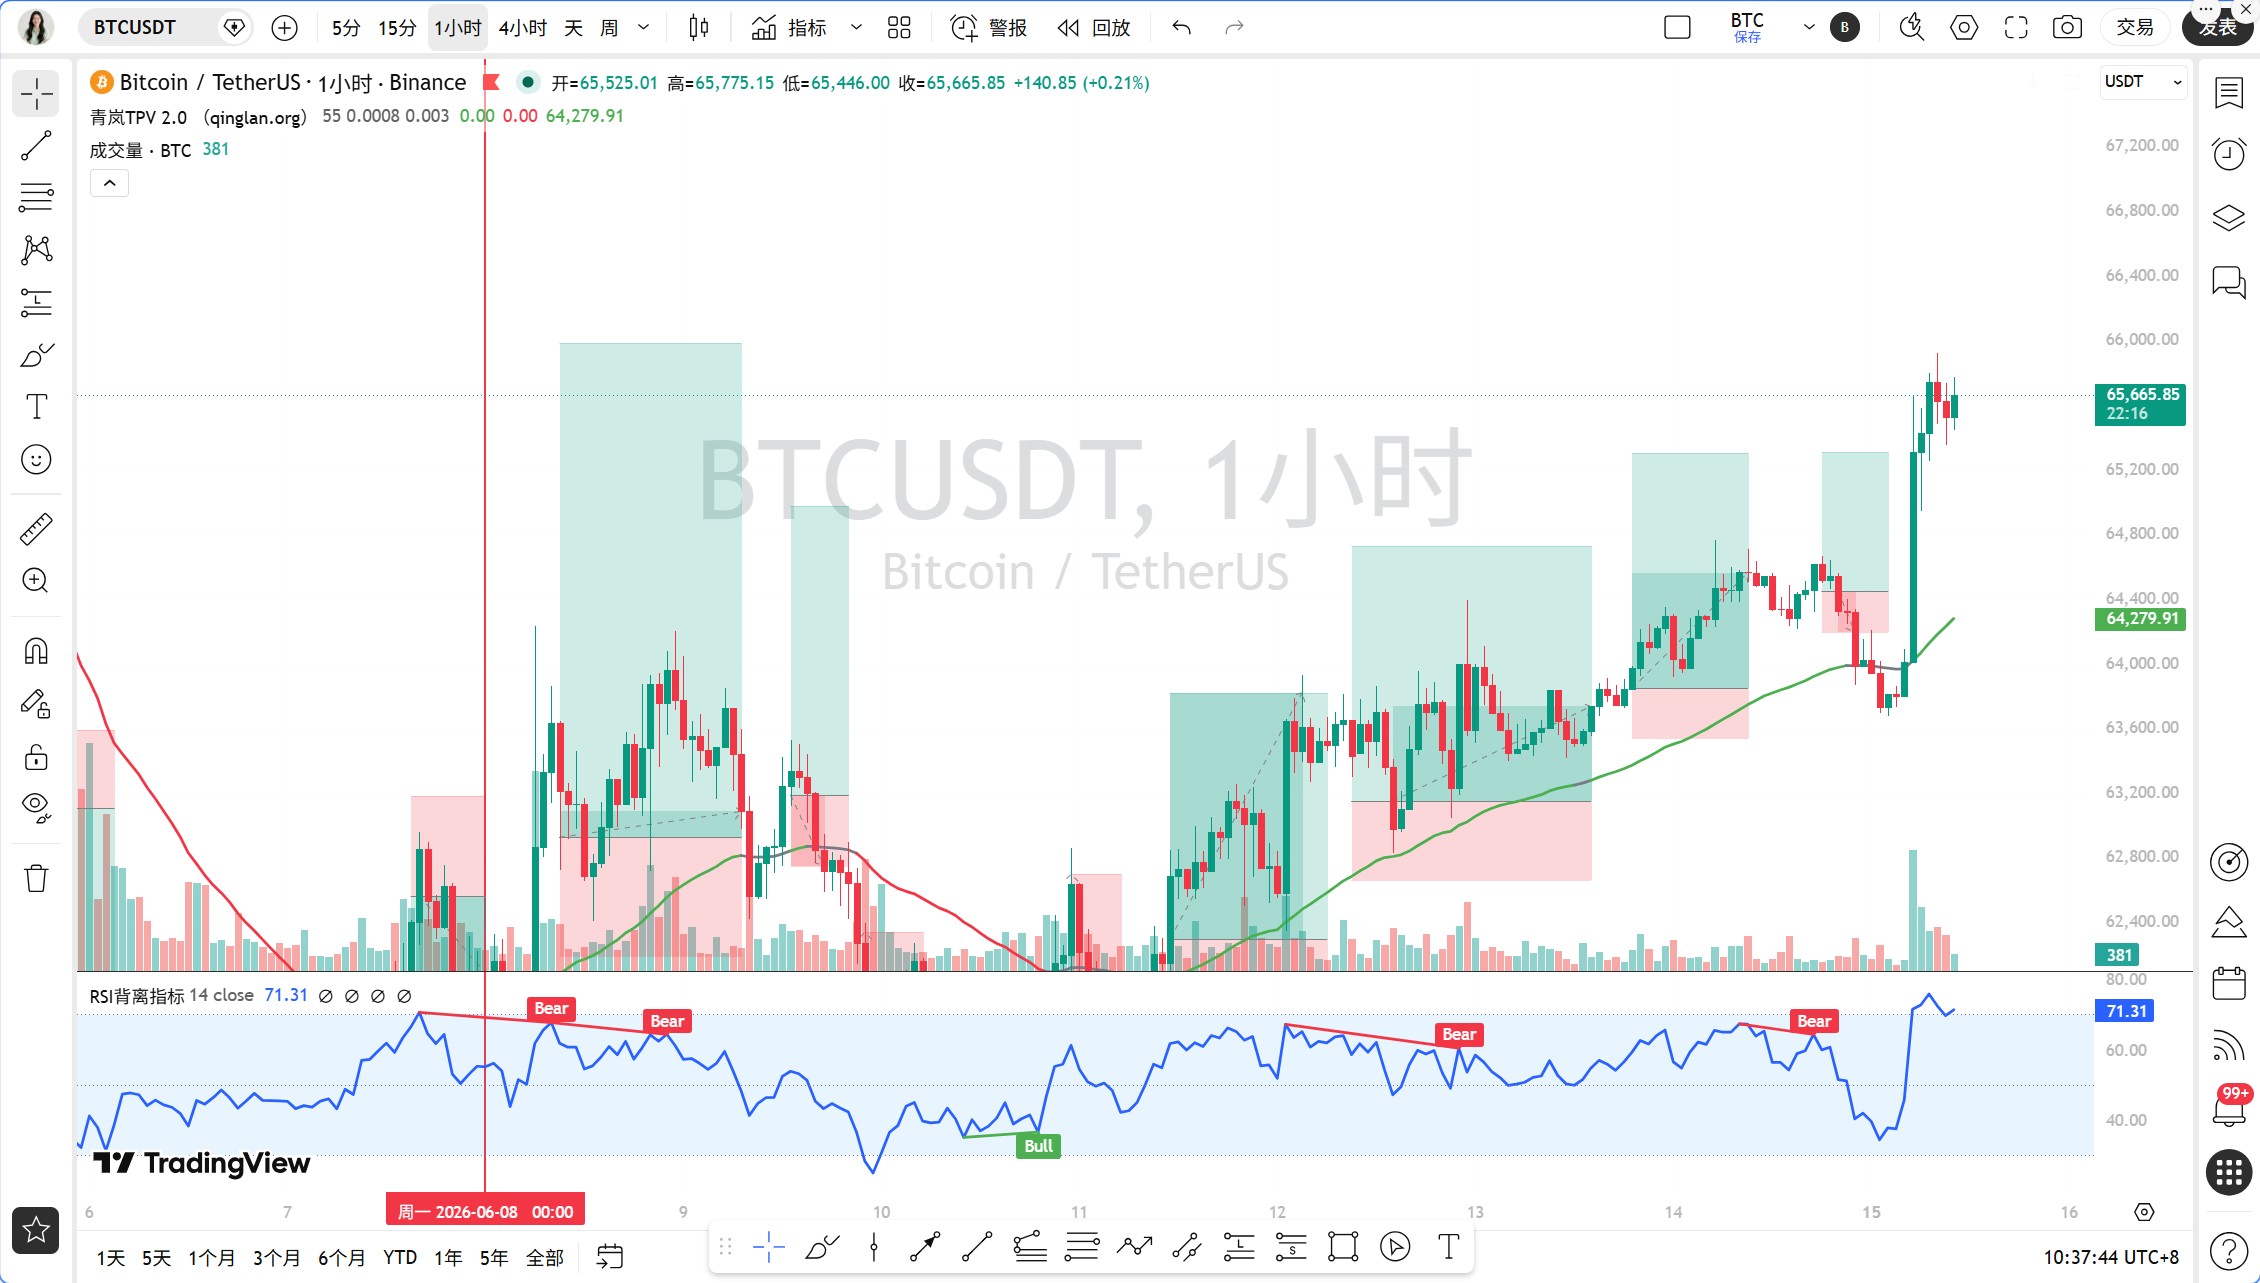
On the 1-hour timeframe, MA5 = 65588, MA10 = 64860, MA30 = 64542. The MACD's DIF = 350.19, DEA = 188.58, and the histogram is 161.61. The DIF and DEA are diverging after a golden cross, and the histogram is at a high level, indicating ample bullish momentum. RSI = 71.29, also in a strong zone. EMA55 = 64341.81, with the current price of 65616 significantly above EMA55 by 1.98%, indicating a one-sided trend state.
On the 15-minute timeframe, MA5 = 65630, MA10 = 65600, MA30 = 65076. The MACD's DIF = 284.47, DEA = 333.70, and the histogram is -49.23, indicating a death cross signal, with short-term momentum weakening. RSI = 51.46, in the neutral zone. The 15-minute chart shows short-term pullback pressure, but the overall trend is still supported by the larger cycle.
TPV Signal Verification
According to the Qinglan TPV system, we use the 1-hour EMA55 as the boundary between long and short positions. The current price of 65616 is far above the EMA55 of 64341.81, and in the past 8 one-hour candles, the closing price has been greater than EMA55 6 times, with only 1 instance crossing it, which does not meet the fluctuation threshold; thus, it is in a one-sided bullish trend.
Conditions for Long Positions: First, the price holds above the 1-hour EMA55; the closing price has been greater than EMA55 for two consecutive one-hour candles, which is already satisfied. Second, for support stabilization, the current price has a clear low point rebound structure on the 4-hour timeframe, forming a bottom-type near 64000, followed by continuous bullish candles indicating effective support. Third, regarding the exhaustion of downward momentum, the daily MACD histogram has been continuously positive, and both the 4-hour and 1-hour MACD histograms are at high levels without signs of shortening; momentum is still being released. Overall, the three conditions are mostly met, confirming the bullish trend.
Conditions for Short Positions are not applicable because the price is far above the EMA55, and there are no signs of pressure. Fluctuation conditions are also not met because the price deviation from EMA55 is 1.98%, far exceeding the 0.3% threshold.
On-Chain Funding Situation
From the on-chain data, the Fear and Greed Index is 18, indicating extreme fear, which is typically viewed as a contrarian indicator; when the market is in extreme fear, it often represents a stage bottom area. The BTC market share is at 56.66%, at a relatively high level, indicating that funds are still concentrating towards BTC while altcoins show relatively weak performance. With a 24-hour increase of 2% and good volume support, it indicates an influx of funds.
Key Support and Resistance Levels
The current key support level is at 64000 USD, which is the key short-term level mentioned in the news and also the low point area on the 4-hour timeframe. If the price retraces to this position without breaking it, the bullish structure will remain intact. The key resistance level above is at 67000 USD, which is the prior high point region and also the pressure point on the daily level. A breakout above 67000 USD will open up upward space, targeting around 70000 USD.
Trading Ideas
Direction: Bullish is the main focus, but waiting for a pullback to enter, avoiding chasing highs.
Entry Conditions: It is recommended to enter when the price pulls back to around the 1-hour EMA55, specifically in the 64300-64500 range, waiting for the 15-minute level to show a bottom-type or long lower shadow stabilization signal before entering. If the price directly breaks and stabilizes above 67000 USD, it may also be considered to chase long, but position size must be controlled.
Stop-loss Level: Strictly set below 64000 USD, specifically at 63800 USD. If it breaks down, the bullish structure will fail and a wait-and-see approach is needed.
Target Levels: The first target is 67000 USD, the second target is 70000 USD. If a top-type or long upper shadow appears around 67000 USD, partial profit-taking may be considered.
Risk Warning
Geopolitical risks still hold uncertainties; Trump's threat to restart military action if the nuclear agreement is not reached could lead to a rapid reversal in market sentiment and requires close attention to news changes.
Follow Qinglan Crypto Class for more trading opportunities! Welcome to visit the official website www.qinglan.org
📊 Qinglan TPV Trading Strategy Backtest Reference
🕒 Last Backtest Time 06-15 07:00:01
Total Analysis: 2255 Backtests: 1819 Accuracy Rate: 70.5% (1283/1819)
免责声明:本文章仅代表作者个人观点,不代表本平台的立场和观点。本文章仅供信息分享,不构成对任何人的任何投资建议。用户与作者之间的任何争议,与本平台无关。如网页中刊载的文章或图片涉及侵权,请提供相关的权利证明和身份证明发送邮件到support@aicoin.com,本平台相关工作人员将会进行核查。