Cryptocurrency Expert: 6.15 Bitcoin Fibonacci Pressure Layer Calculation! Every rebound at each level is an excellent opportunity to go short! Latest market analysis and trading advice
Bitcoin's current price is 63800. During the weekend gathering, several crypto friends who bought near ninety thousand were shocked for a whole weekend. They buy and sell based on intuition, holding on during the drop, and hurriedly chasing orders during the rise. Honestly, it's impressive that they are still alive after this major correction. The liquidation point for these big players is between 57000 and 55000. The current market is characterized by typical bearish grinding; don't fantasize about a sudden surge or drop. The larger cycle's downtrend has not broken, while the smaller cycle's oscillation and repair require patience. Those who can withstand it should just wait it out; it's still advisable for everyone to develop the habit of setting stop losses.
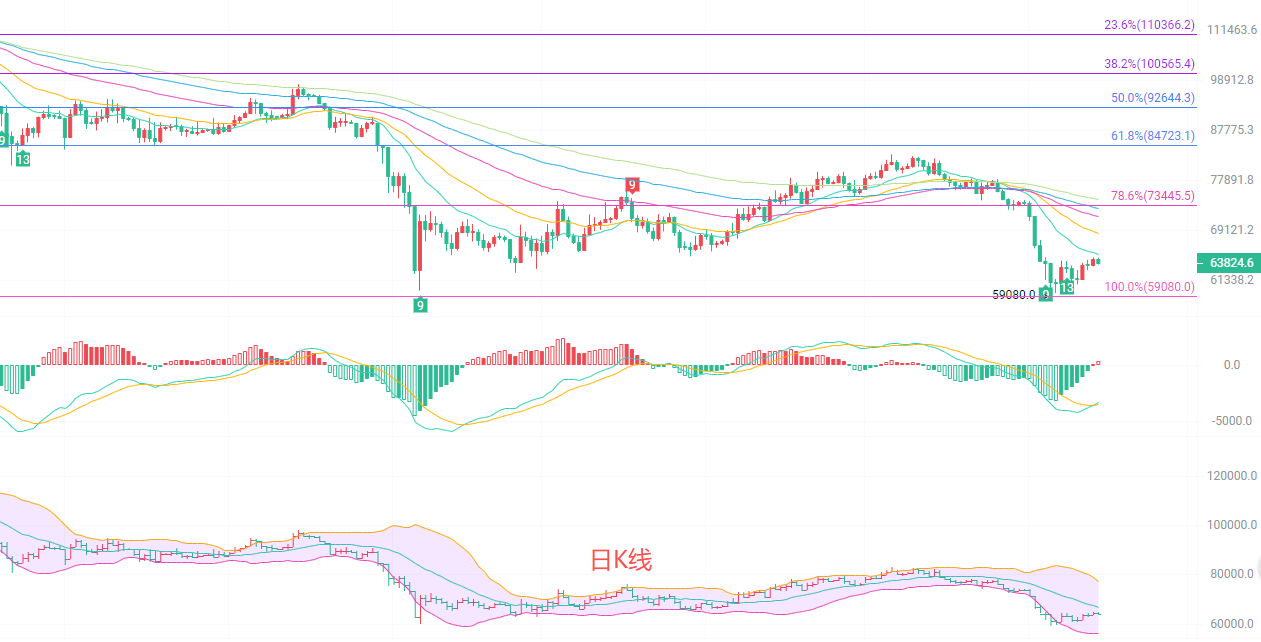
The daily K-line is overall in a weak recovery phase after a significant drop. The moving average system is lined up downwards, with the 15, 30, and 60-period EMAs all pressing down above the price. The first strong resistance above is at 73445, which is at the 0.786 Fibonacci retracement level; the middle track of the Bollinger Bands is 66884, which also forms a suppression, while the lower track at 56399 serves as a key support for the long term. The MACD indicator shows a temporary slowdown in the downward momentum but has not reversed; the previous low of 59080 marks the bottom of this decline. As long as the price cannot rise above the 30 EMA, the daily trend remains bearish, and any rebound should be considered a weak repair without conditions for a direct reversal to bullish.
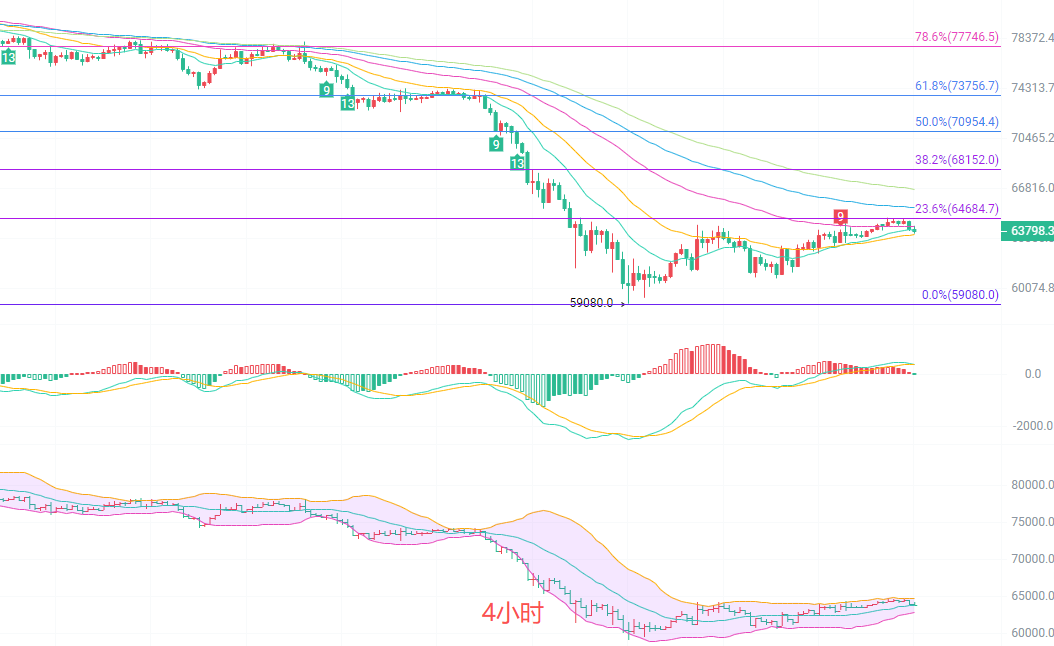
The four-hour K-line has formed a low-level consolidation pattern after the decline. The short-term 15 and 30 EMAs are intertwined and flat, with prices running closely below the moving averages. The 0.236 Fibonacci pressure level at 64684 is the first hurdle for a short-term rebound; the Bollinger Bands are narrowing, with the upper track at 64750 and the lower track at 62871, indicating a clear range-bound pattern. The MACD dual lines are slowly flattening, and the upward counterattack lacks strength. The support at the four-hour bottom of 59080 is solid, and there is no risk of a significant drop in the short term, but there is weakness in the upward breakthrough, with both bulls and bears caught in a tug-of-war, characteristic of a weak recovery oscillation after a drop. The large downtrend has not fundamentally changed.
Short-term strategy reference: Follow the larger cycle trend, small stop losses, quick in and out.
Position to go long from 63000 to 62500, with a stop loss at 62000, targeting 63500 to 64500.
Position to go short from 64500 to 65000, with a stop loss at 65500, targeting 63500 to 62500.
Specific operations should be based on real-time market data, for more detailed information, you can consult the author. The article publication may have a delay; advice is for reference only and risk is borne by the reader.

Kind Reminder: The above content is solely created by the author. The advertisements at the end of the article and in the comments section are unrelated to the author; please be cautious in discerning them. Thank you for reading.
免责声明:本文章仅代表作者个人观点,不代表本平台的立场和观点。本文章仅供信息分享,不构成对任何人的任何投资建议。用户与作者之间的任何争议,与本平台无关。如网页中刊载的文章或图片涉及侵权,请提供相关的权利证明和身份证明发送邮件到support@aicoin.com,本平台相关工作人员将会进行核查。