Crypto Circle Academician: The bearish trend of Ethereum on June 15 is deeply entrenched, has the short-term rebound height been locked? Latest market analysis and operational suggestions
The current price of Ethereum is 1666. Now the overall environment for Ethereum is going down with no change in the foundation. Do not overthink a major reversal during short-term consolidation, don't go all in when trying to catch the bottom. The biggest risk in dealing with Ethereum is not understanding the cycle; with a major downward trend, jumping in to catch the bottom during a small rebound may lead to getting stuck halfway up when the rebound is fleeting. Many fans privately ask me if they can catch the bottom now or if the market will go down. Don't expect 1660 to be the absolute bottom; the real bottom has never been carved out through consolidation, often requiring a wave of panic selling. It's better to take small profits when you see them in the short term.
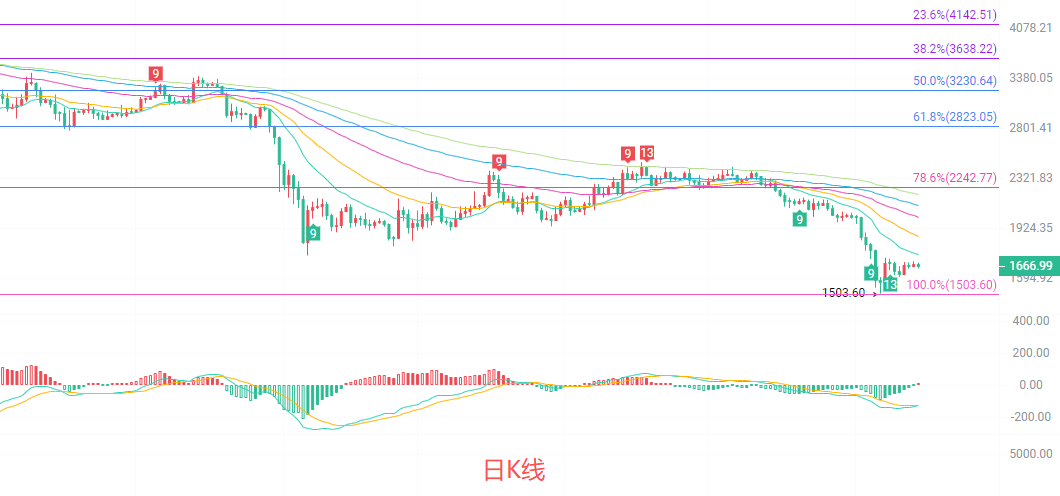
The daily candlestick chart shows a low-level oscillation pattern after a deep decline. The moving average system is fully aligned downwards, with 15, 30, and 60 EMA all pressing down above the price. The first major resistance above is at 2008, with a mid-term strong resistance level at 2242. The previous low of 1503 serves as the ultimate support for this round of decline, and the current price has a slight distance from this low. The MACD indicator shows a slowdown in downward momentum, but the upward recovery force is very weak; the Bollinger Bands are opening downwards, with the price running close to the middle and lower bands. The overall daily trend remains dominated by a downward movement, and no reversal base-building signal has emerged. The rebound can only be defined as a weak repair during the decline.
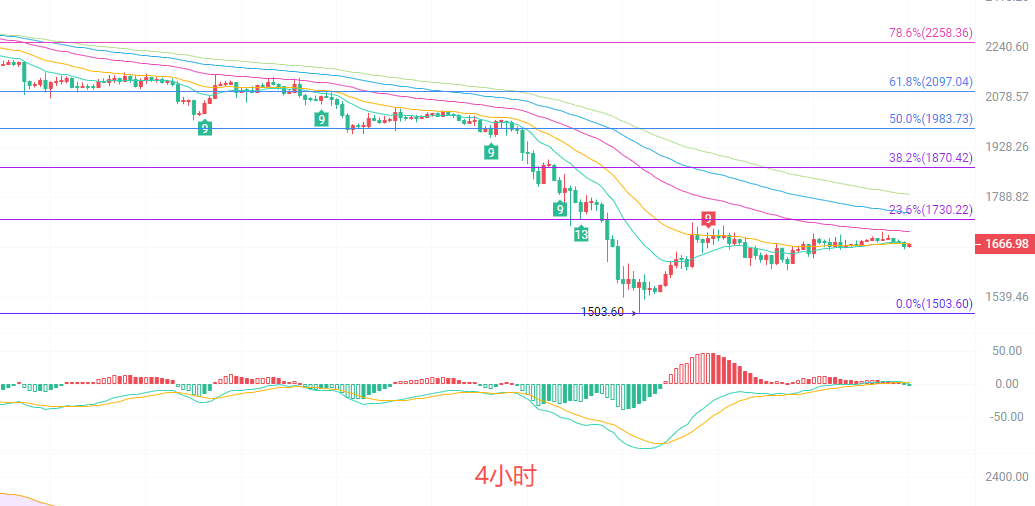
The four-hour candlestick chart shows a halt to the decline and a sideways movement. The short-term EMA 15 and 30 are intertwined and sticking around 1669, with the price slightly pressured by the moving average; the key support below is at 1651, which is the lower Bollinger Band, while the upper Bollinger Band resistance is at 1688. The 23.6% Fibonacci retracement level at 1730 is a strong resistance level in the short term. The MACD downward momentum is exhausting, indicating short-term signs of a consolidation bottom. Compared to the overall bearish daily environment, the four-hour chart only belongs to a slight buffer rebound zone without breaking out into a rising structure. The longer the sideways movement lasts, the stronger the subsequent directional choice will be. Only a breakout above resistance can open repair space, while a breakdown below support would restart the probing for a bottom.
Short-term reference:
Shorting from 1720 to 1750, stop loss at 1800, target looking at 1650 to 1600
Going long from 1650 to 1600, stop loss at 1550, target looking at 1680 to 1720
Specific operations should be based on real-time data from the market. For more details, you can consult the author. The publication of this article may have delays, and the suggestions are for reference only; the risk is borne by the user.

Warm reminder: The above content is solely created by the author on Weibo. The ads at the end of the article and in the comments section are unrelated to the author. Please discern carefully, and thank you for reading.
免责声明:本文章仅代表作者个人观点,不代表本平台的立场和观点。本文章仅供信息分享,不构成对任何人的任何投资建议。用户与作者之间的任何争议,与本平台无关。如网页中刊载的文章或图片涉及侵权,请提供相关的权利证明和身份证明发送邮件到support@aicoin.com,本平台相关工作人员将会进行核查。