Today we will not beat around the bush and will focus on one thing — to thoroughly break down the clean step indicators from the last lesson. The core is actually very simple, just adding one filtering condition to the basic version. I will explain the function, placement, and combination logic of each judgment clearly, and by the end, you will be able to write and use it yourself.
First, let’s clarify the difference between the advanced version and the basic version: the basic version is "alert when the price crosses above the 20-day moving average," which has only one triggering condition; while the advanced version is "the alert is triggered only when the price is above the 60-day moving average and simultaneously crosses above the 20-day moving average."
Don’t underestimate the additional condition; the 60-day moving average acts as a "big trend filter," helping us filter out ineffective signals that go against the grand trend. Simply put: the triggering condition tells us "what just happened," while the filtering condition tells us "whether to pay attention to it this time."
I will break down all cases into 5 steps, following this logic will keep everything in order:
- Calculate: Determine the required indicator values.
- Trigger: Identify which action counts as a signal.
- Filter: Assess whether the current market environment is suitable for trading (this lesson's focus).
- Combine: Only when both trigger and filter are met, it becomes a valid signal.
- Display: Draw lines, mark symbols, and set alerts on the K-line for easy viewing.
⚠️ Let me be clear in advance: all content today is for teaching and sharing purposes, and does not constitute any investment advice. Everyone should make rational judgments and operate cautiously.


Part One: Basic Moving Average Combinations (20-day + 60-day)
Let's start with the basics of how to calculate the two core moving averages. Essentially, it’s just using the MA function, inputting the closing price and the period:
- MA20 = MA (closing price, 20): 20-day moving average, more sensitive to price, reacts quickly.
- MA60 = MA (closing price, 60): 60-day moving average, reacts slowly but reflects the big trend.
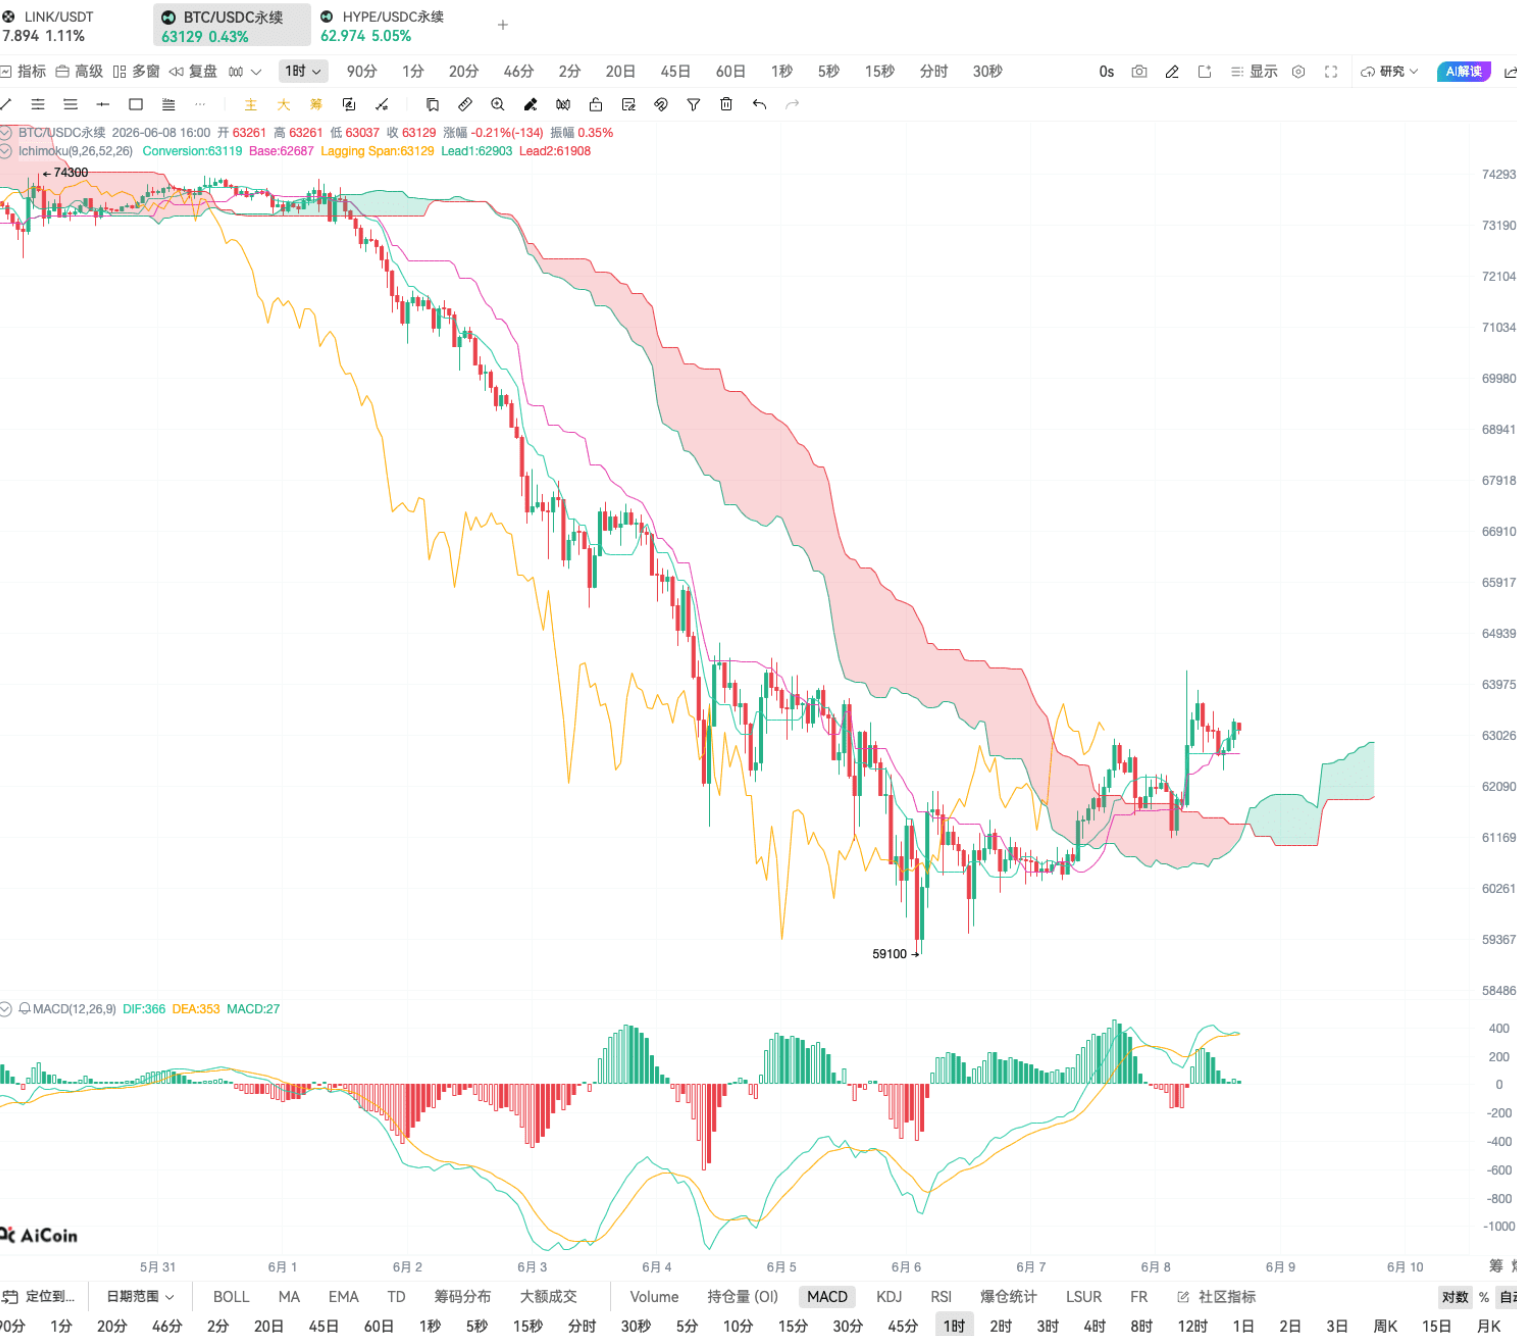
First, let’s plot these two lines using the plot function in the AI script. For plotting MA20, it would be plot(MA20, title="MA20", color=blue, linewidth=2), and similarly for MA60. Once plotted, the blue one that fluctuates greatly is MA20, while the orange one that is smoother is MA60.
Key: Distinguishing "State" and "Event"
This is where many beginners easily get confused, and it’s essential to remember:
- Filtering condition = State: closing price > MA60, this is a sustained state, representing the current big trend is upwards.
- Trigger condition = Event: closing price crosses above MA20, this is an instantaneous action, indicating signs of a short-term launch.

Why can't we just use the filtering condition for alerts? Because if the price remains above the 60-day moving average, the filtering condition continues to be satisfied, leading to constant alerts that are completely unusable. Meanwhile, "crossing" is a one-time event, reminding only at the moment it occurs, making it just right for triggering signals.

The role of the filtering condition is to filter out all signals of "short-term rebounds when the big trend is downward." As you can see, if there’s no 60-day moving average filter, any time the price crosses above the 20-day moving average an alert will fire, resulting in a K-line chart filled with signals; after adding the filter, it retains only the upward crosses during an upward big trend, significantly reducing noise.
Finally, merging the two conditions, the ultimate signal is: closing price > MA60 AND closing price crosses above MA20. When this condition is met, we will mark a "buy" on the K-line using the plottext function and set a pop-up alert, perfect.

Part Two: Advanced Combination (EMA Golden Cross + RSI Filter)
Once mastering the moving average logic, let's upgrade using EMA (Exponential Moving Average) combined with RSI (Relative Strength Index) for more precise signals.
The steps remain the same:
- Calculate: first calculate EMA5, EMA60, and RSI (4).
- Trigger: EMA5 crosses above EMA60 (golden cross).
- Filter: RSI > 50 (indicating sufficient bullish momentum).
- Combine:
EMA5 crosses above EMA60 AND RSI > 50. - Display: plot lines + mark signals.
The benefit of this combination is that RSI helps filter out "false golden crosses with insufficient momentum." Moreover, the strictness of the filter can be adjusted: setting the RSI threshold to 70 will provide fewer signals but with higher quality; setting it to 30 will increase the number of signals but might include some noise. Everyone can adjust according to their trading style.


Part Three: Bollinger Band Breakout Alerts
Bollinger Bands are a commonly used indicator, known as the "king of primary indicators." In fact, its logic is also very simple, consisting of three lines:
- Middle track: MA20 (20-day moving average).
- Upper track: Middle track + 2 times standard deviation.
- Lower track: Middle track - 2 times standard deviation.
We can use it for breakout alerts:
- Crossing above the upper Bollinger Band → Breakout signal.
- Crossing below the lower Bollinger Band → Breakdown signal.
The coding isn’t complex; first, calculate the three lines of the Bollinger Bands, then set the conditions: closing price crosses above upper band or closing price crosses below lower band, and trigger a pop-up alert when these conditions are met. From historical trends, Bollinger Band breakouts often correspond to phases of accelerated market activity, making them highly valuable for reference.

Part Four: Backtesting Function and Cautions
Simply writing indicators is not enough; we must also know how effective they are, which is when the backtesting function comes into play.
The logic of backtesting is: first define the buying and selling conditions, such as "buy when EMA5 crosses above EMA60, sell when EMA5 crosses below EMA60," then write the two trading functions, s_long (close long) and enter_long (open long), into the code. Once the backtest is run, the system will automatically simulate the trading profit based on this indicator in historical markets.
Here is a crucial point: adding filtering conditions does not necessarily improve returns. Sometimes overly strict conditions can miss out on significant market moves; sometimes overly lenient conditions can lead to frequent stop losses. There are no universal indicators, only those suited for the current market; everyone should backtest and adjust often.

Pitfall Guide: The 5 Most Common Mistakes Beginners Make
- Too many conditions added: piling on seven or eight conditions right from the start, making the system infinitely complex, leaving one unable to understand it themselves. In fact, two conditions (trigger + filter) are enough; simplicity is key.
- Distinguishing between trigger and filter: treating states as trigger conditions, leading to constant alerts; or treating events as filtering conditions, resulting in few signals being generated.
- Forgetting to draw lines: only setting alerts without drawing lines while writing code, causing confusion about why signals occur, making it impossible to backtrack and optimize.
- Frequent alerts from filtering conditions: filtering conditions represent a sustained state, so they absolutely cannot be used solely for alerts; otherwise, they will become bothersome.
- Over-reliance on backtesting results: backtesting is merely a simulation of historical data, not indicative of future returns. Short-term backtesting results may look good simply because they suit that specific period; it’s essential to look at a longer timeframe.


The core of today’s lesson is summed up in one sentence: Triggers look at events, filters look at environments. In the future, no matter what indicators you write, they can always be broken down into the formula "trigger condition + filtering condition," making the thought process clear.
Indicators are always just auxiliary tools; when it comes to making actual trades, one must consider the overall market conditions and fund flows for a comprehensive judgment. After class, everyone can try writing their trading needs into code; practice a few times and you’ll become proficient.
There are live broadcasts every day; make sure to tune in and become stronger together. AiCoin friends are waiting for you! Book now👇:
https://www.aicoin.com/zh-Hans/live/list?tab=upcoming
This article reflects the personal views of the author and does not represent the position or views of this platform. This article is for informational sharing only and does not constitute any investment advice to anyone.
免责声明:本文章仅代表作者个人观点,不代表本平台的立场和观点。本文章仅供信息分享,不构成对任何人的任何投资建议。用户与作者之间的任何争议,与本平台无关。如网页中刊载的文章或图片涉及侵权,请提供相关的权利证明和身份证明发送邮件到support@aicoin.com,本平台相关工作人员将会进行核查。